This circular arrows diagram sample shows the systems development life cycle (SDLC) stages.
"The systems development life cycle (SDLC), also referred to as the application development life-cycle, is a term used in systems engineering, information systems and software engineering to describe a process for planning, creating, testing, and deploying an information system. The systems development life-cycle concept applies to a range of hardware and software configurations, as a system can be composed of hardware only, software only, or a combination of both." [Systems development life-cycle. Wikipedia]
The arrow circle diagram example "Systems development life cycle" was created using the ConceptDraw PRO diagramming and vector drawing software extended with the Circular Arrows Diagrams solution from the area "What is a Diagram" of ConceptDraw Solution Park.
Circular arrows diagram

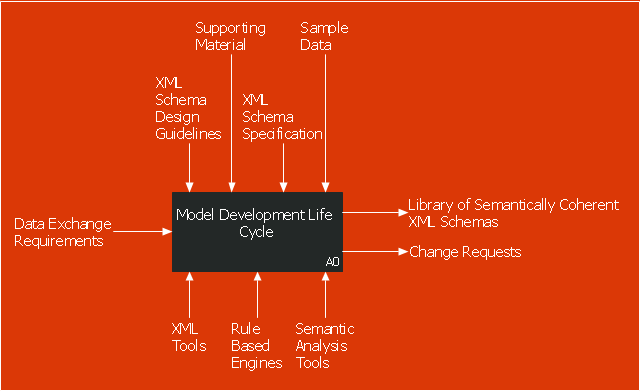
This IDEF0 diagram sample was created on the base of the figure from the website of the Engineering Laboratory of the National Institute of Standards and Technology (NIST). [mel.nist.gov/ msidlibrary/ doc/ kc_ morris/ gsa-final_ files/ image002.gif]
"The systems development life cycle (SDLC), also referred to as the application development life-cycle, is a term used in systems engineering, information systems and software engineering to describe a process for planning, creating, testing, and deploying an information system. The systems development life-cycle concept applies to a range of hardware and software configurations, as a system can be composed of hardware only, software only, or a combination of both." [Systems development life cycle. Wikipedia]
The IDEF0 diagram example "Model development life cycle" was created using the ConceptDraw PRO diagramming and vector drawing software extended with the IDEF0 Diagrams solution from the Software Development area of ConceptDraw Solution Park.
IDEF0 diagram
SSADM Diagram

Structured Systems Analysis and Design Method (SSADM) with ConceptDraw DIAGRAM

Circular Flow Diagram Template

Systems Engineering
Basic Diagramming


 Block Diagrams
Block diagrams solution extends ConceptDraw DIAGRAM software with templates, samples and libraries of vector stencils for drawing the block diagrams.
 Circular Arrows Diagrams
Circular Arrows Diagrams solution extends ConceptDraw DIAGRAM with extensive drawing tools, predesigned samples, Circular flow diagram template for quick start, and a library of ready circular arrow vector stencils for drawing Circular Arrow Diagrams, Segmented Cycle Diagrams, and Circular Flow Diagrams. The elements in this solution help managers, analysts, business advisers, marketing experts, scientists, lecturers, and other knowledge workers in their daily work.
Yourdon and Coad Diagram

Booch OOD Diagram

This arrow loop cycle diagram sample was created on the base of the figure illustrating the webpage "Exploratory Advanced Research Program Hand-Off Workshops" from the US Department of Transportation - Federal Highway Administration (FHWA) website. "The FHWA’s research and technology innovation life cycle illustrates that research and technology development are not insular activities, but integrated processes that together constitute a system.
Following general workshop discussion, a number of common issues emerged among the groups. These centered around the research life cycle, communicating the value of exploratory advanced research, and continued project funding. It was felt that there is a general need to better describe the research and deployment cycle specific to highway transportation and possibly to highway research fields, such as materials or system planning. Research life cycle diagrams show a very linear, chronological process but it is not necessarily that way in reality." [fhwa.dot.gov/ advancedresearch/ pubs/ 11034/ ]
The arrow loop diagram example "Innovation life cycle" was created using the ConceptDraw PRO diagramming and vector drawing software extended with the Target and Circular Diagrams solution from the Marketing area of ConceptDraw Solution Park.
www.conceptdraw.com/ solution-park/ marketing-target-and-circular-diagrams
Arrow loop cycle diagram
JSD - Jackson system development

ORM Diagram

Waterfall Bar Chart

- Systems development life cycle | Structured Systems Analysis and ...
- Draw A Sketch Of System Development Cycle
- Systems development life cycle | SSADM Diagram | Structured ...
- Systems development life cycle | Circular Flow Diagram Template ...
- Circular Arrows Diagrams | Systems development life cycle ...
- Systems development life cycle | Process Flowchart | JSD - Jackson ...
- Systems development life cycle | Innovation life cycle - Arrow loop ...
- Model development life cycle - IDEF0 diagram | Systems ...
- Systems development life cycle | Process Flowchart | Network ...
- Process Flowchart | Systems development life cycle | Circular Flow ...
- Circular Flow Diagram Template | Systems development life cycle ...
- Systems development life cycle
- Innovation life cycle - Arrow loop diagram | Systems development ...
- Systems development life cycle | Process Flowchart | Circular Flow ...
- Data Flow Diagram Example In Sdlc Phases
- Systems development life cycle | SSADM Diagram | Circular Flow ...
- Systems development life cycle | SSADM Diagram | Circular Arrows ...
- Loyalty - Arrow circle diagram | Systems development life cycle ...
- Innovation life cycle - Arrow loop diagram | BPM life cycle | Systems ...
- Sample Flow Charts In System Development Life Cycle