HelpDesk
How to Create a SIPOC Diagram

 Business Process Mapping
The Business Process Mapping solution for ConceptDraw DIAGRAM is for users involved in process mapping and creating SIPOC diagrams.
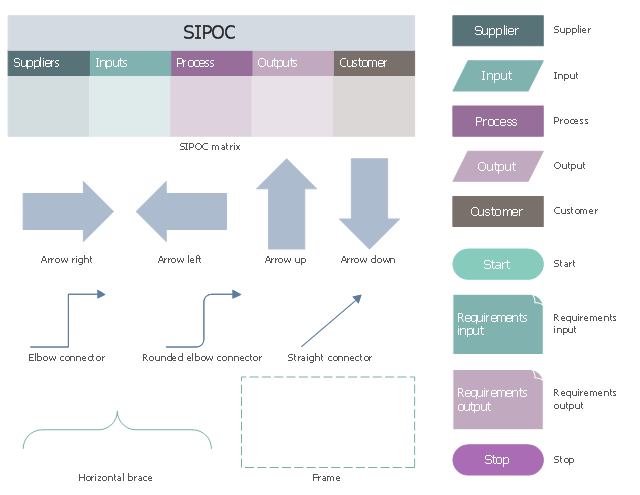
The vector stencils library "SIPOC diagrams" contains 19 symbols.
Use it for business process mapping with ConceptDraw PRO diagramming and business graphics software.
"In process improvement, a SIPOC (sometimes COPIS) is a tool that summarizes the inputs and outputs of one or more processes in table form. The acronym SIPOC stands for suppliers, inputs, process, outputs, and customers which form the columns of the table. It was in use at least as early as the Total Quality Management programs of the late 1980s and continues to be used today in Six Sigma, Lean manufacturing, and business process management." [SIPOC. Wikipedia]
The symbols example "Design elements - SIPOC diagrams" is included in the Business Process Mapping solution from the Business Processes area of ConceptDraw Solution Park.
SIPOC diagram symbols
SIPOC Diagram

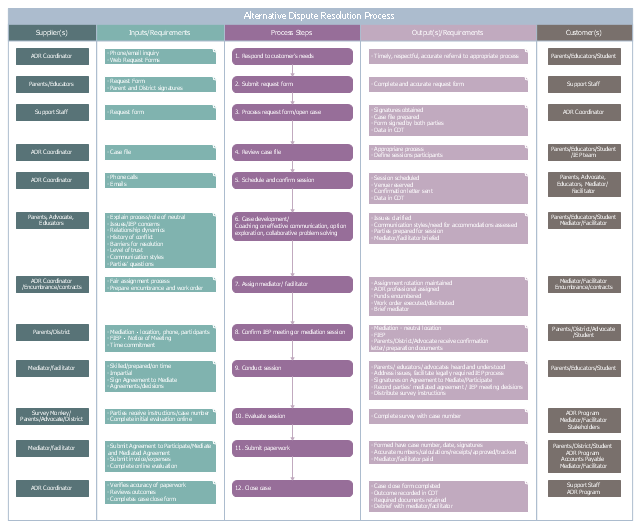
This SIPOC diagram example was designed on the base of the Alternative Dispute Resolution Process SIPOC Diagram on the Minnesota.gov portal.
"Instructions:
1) Identify beginning and ending process steps (boundaries);
2) Identify 4‐6 high‐level steps between process boundaries;
3) Identify key outputs and the customers of those outputs;
4) Identify inputs and suppliers;
5) Identify critical to quality requirements for the inputs, process steps, and outputs (you will have to verify this information later with data collection)."
[mn.gov/ admin/ images/ sipoc_ diagram_ example.pdf]
The example "Alternative Dispute Resolution Process SIPOC Diagram" was drawn using the ConceptDraw PRO diagramming and business graphics software extended with the Business Process Mapping solution from the Business Processes area of ConceptDraw Solution Park.
SIPOC diagram example
Technical Flow Chart

IDEF0 standard with ConceptDraw DIAGRAM

 Jackson Structured Programming (JSP) Diagrams
The Jackson Structured Programming (JSP) Diagram solution extends the functionality and drawing abilities of the ConceptDraw DIAGRAM software with set of illustrative JSP diagrams samples and large variety of predesigned vector objects of actions, processes, procedures, selection, iteration, as well as arrows and connectors to join the objects during Jackson structured development and designing Jackson structured programming diagrams, JSP diagram, Jackson structure diagram (JSD), Program structure diagram. The powerful abilities of this solution make the ConceptDraw DIAGRAM ideal assistant for programmers, software developers, structural programmers, computer engineers, applications constructors, designers, specialists in structured programming and Jackson systems design, and other technical, computer and software specialists.
Data Flow Diagram

Basic Flowchart Symbols and Meaning


Data Flow Diagram Symbols. DFD Library

Data Flow Diagram Process

HelpDesk
Event-driven Process Chain (EPC) Diagram Software
 Diagram Software *")
Business Process Flowchart Symbols

Data Flow Diagram Model

Example Process Flow

Business Processes description with ConceptDraw DIAGRAM

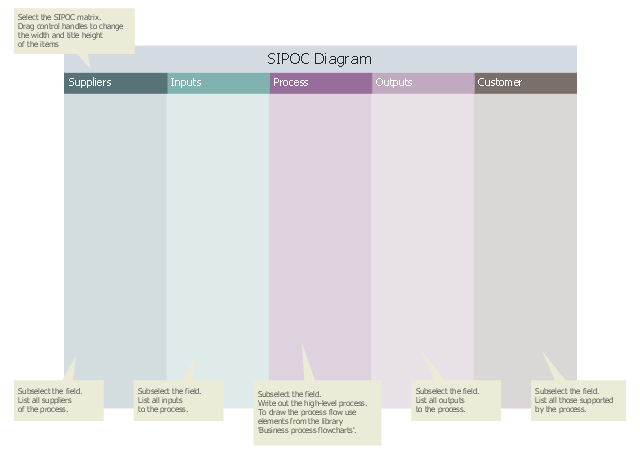
Use this SIPOC diagram template for business process mapping with ConceptDraw PRO diagramming and business graphics software.
"In process improvement, a SIPOC (sometimes COPIS) is a tool that summarizes the inputs and outputs of one or more processes in table form. The acronym SIPOC stands for suppliers, inputs, process, outputs, and customers which form the columns of the table." [SIPOC. Wikipedia]
The template "SIPOC diagram" is included in the Business Process Mapping solution from the Business Processes area of ConceptDraw Solution Park.
SIPOC table
- Input Process Output Diagram Example
- Example Of Flowchart That Has Input Process Output And Discussion
- Flow chart Example. Warehouse Flowchart | Input Process Output ...
- How To Draw Input Output Diagram
- Electrical Symbols, Electrical Diagram Symbols | Input Process ...
- Business Process Mapping | IDEF0 Diagrams | Input Process Output ...
- Suppliers Inputs Process Outputs Customers
- Input Process Output Diagram
- Food security assessment - Flowchart | Flowcharts | Flowchart Of ...
- Input Process Output In Hotel Reservation
- Input Output Diagram Creator
- CS Odessa Releases a Paid Business Process Mapping Solution for ...
- Example Of Hotel Input Process And Output That Related To
- Draw The Input Output Process Diagram In Management
- Example Input And Output Flowchart
- Fishbone diagram - Causes of low-quality output | Event-driven ...
- IDEF4 Standard | Sales Flowcharts | Input Process Output In Hotel ...
- Basic Flowchart Symbols and Meaning | Process Flowchart | Sales ...
- Input Output Flow Chart Template
- Draw The Input Output Process Diagram In Operation Management