HelpDesk
How to Create a SIPOC Diagram
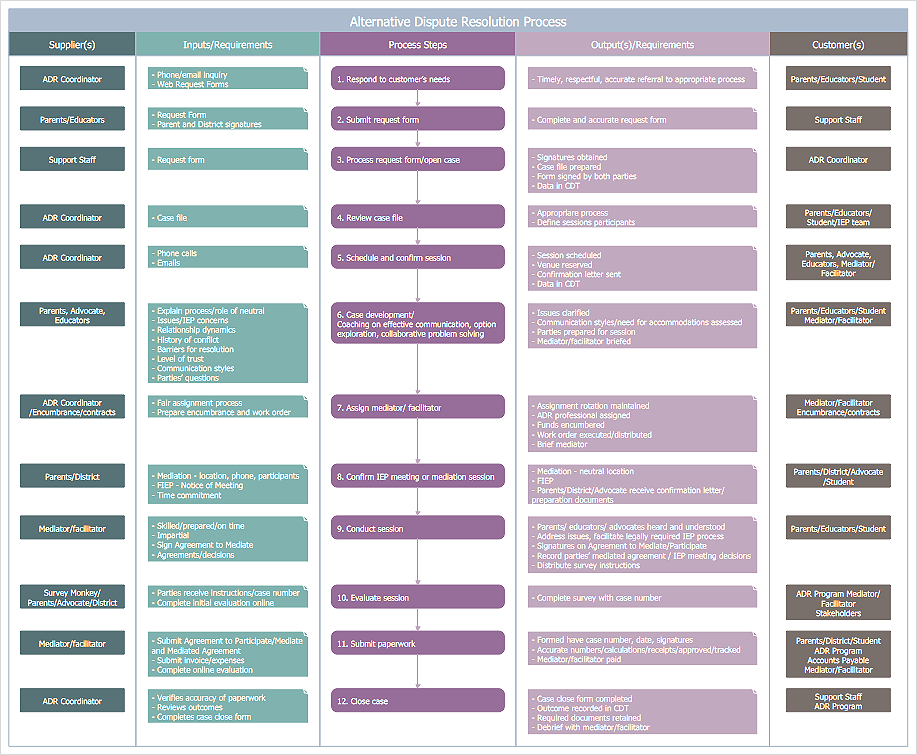
 Business Process Mapping
The Business Process Mapping solution for ConceptDraw DIAGRAM is for users involved in process mapping and creating SIPOC diagrams.
Data Flow Diagram Process

Basic Flowchart Symbols and Meaning


Data Flow Diagram Symbols. DFD Library

IDEF0 standard with ConceptDraw DIAGRAM

Swim Lane Diagrams

HelpDesk
Event-driven Process Chain (EPC) Diagram Software

- Input Process Output Diagram Example
- Example Of Flowchart That Has Input Process Output And Discussion
- How To Draw Input Output Diagram
- System Diagram Examples Input Output
- Input Output Diagram Example
- Draw The Flow Chart Showing Data Processing Stages Input ...
- Input Output Diagram Tool
- Input Output Process Diagrame
- Business Process Mapping | Inputs Processes And Outputs Examples
- Input Process Output Design Flow