Business Diagram Software
ConceptDraw business diagram Software is the most powerful business and relational charting software. Create advanced, completely customizable flow charts, organizational charts, business process diagrams, work flow diagrams, audit diagram, value stream maps, TQM diagrams, ERD diagrams, EPC diagrams, marketing diagrams, cause and effect diagrams, dashboards, infographics and other relational business diagrams from your data.
Examples of Flowcharts, Org Charts and More
ConceptDraw examples covers a broad spectrum of business graphics categories. We separated all the graphic documents on application areas and had produced multiple solutions for each of them. ConceptDraw provides a wide variety of examples such as flowcharts, organizational charts, business charts, UML diagrams, database and ERD, directional map, network diagrams and lots more. Each solution accommodates 10+ examples that shows specific application cases of a diagram. ConceptDraw STORE is an application for downloading solutions with examples, templates and stencil libraries. Please choose any examples you are interested in, alternatively download them for free; you will need to install ConceptDraw to view them. As you will see, ConceptDraw is very powerful, you can use more than 10000 symbols, examples, and many pre-drawn templates, to create your own spectacular flowcharts, business diagrams, network diagrams and lots more, effortlessly, and in no time at all.
Organizational Charts
Organizational Charts solution extends ConceptDraw DIAGRAM software with samples, templates and library of vector stencils for drawing the org charts.
Draw Company Structure with Organization Charting Software
Draw Company Structure Diagram - get the detailed information about the company structure and hierarchy - who execute what tasks and who is in charge at this company. This information shows the reasoning and success of business and is indispensable for investors and financial institutions.
25 Typical Orgcharts
The 25 Typical Orgcharts solution contains powerful organizational structure and organizational management drawing tools, a variety of professionally designed organization chart and matrix organization structure samples, 25 templates based on various orga
3 Circle Venn Diagram. Venn Diagram Example
This template shows the Venn Diagram. It was created in ConceptDraw DIAGRAM diagramming and vector drawing software using the ready-to-use objects from the Venn Diagrams Solution from the "Diagrams" area of ConceptDraw Solution Park.Venn Diagrams visualize all possible logical intersections between several sets and are widely used in mathematics, logic, statistics, marketing, sociology, etc.
Basic Diagramming
Perfect charts and graphics diagramming software with rich examples and template. ConceptDraw is ideal to draw Charts and Graphics.
3 Circle Venn. Venn Diagram Example
This example shows the 3 Circle Venn Diagram. The Venn Diagrams visualize all possible logical intersections between several sets. On this example you can see the intersections of 3 sets. Venn Diagrams are widely used in mathematics, logic, statistics, marketing, sociology, etc.
ConceptDraw Solution Park
ConceptDraw Solution Park collects graphic extensions, examples and learning materials
Simple Drawing Applications for Mac
ConceptDraw gives the ability to draw simple diagrams like flowcharts, block diagrams, bar charts, histograms, pie charts, divided bar diagrams, line graphs, area charts, scatter plots, circular arrows diagrams, Venn diagrams, bubble diagrams, concept maps, and others.HelpDesk
How to Draw a Circular Arrows Diagram
The cyclic recurrence is a fundamental property of multiple systems. The cycle is a process which consists of elements (phases, stages, stages) following each other. Many processes in astronomy, biology, chemistry, physics, mathematics, etc. have a cycle properties. It is also widely used in information technologies and marketing analysis. Graphical representation of cyclic processes can have many forms. It can be a circle, parabola, hyperbola, ellipse, and others. A Circular Arrows Diagram is used as one of the statistical charts in the business, mass media and marketing. ConceptDraw DIAGRAM provides tools for making easy drawing Circular Arrows Diagrams.HelpDesk
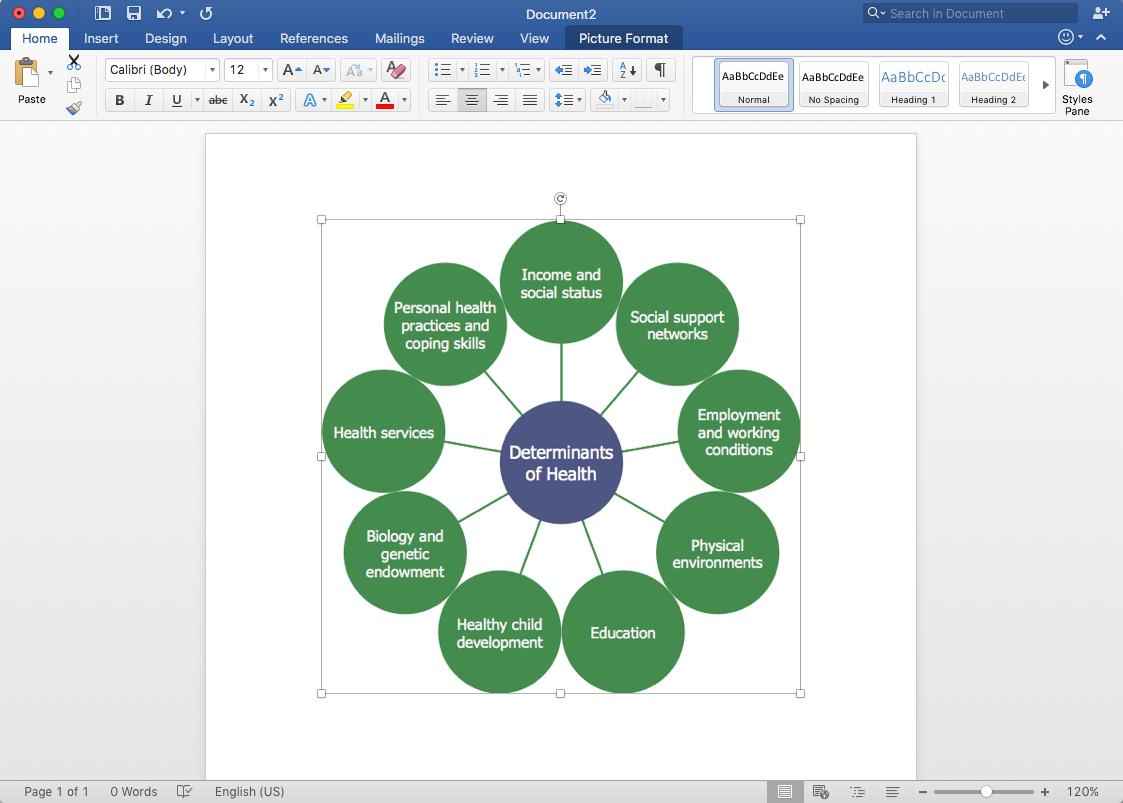
How to Add a Circle-Spoke Diagram to MS Word Document
ConceptDraw DIAGRAM allows you to easily create various marketing charts, including the circle-spoke diagrams and then insert them into an MS Word document.Venn Diagram Examples for Problem Solving. Environmental Social Science. Human Sustainability Confluence
The Venn diagram example below shows sustainable development at the confluence of three constituent parts.Create your Venn diagrams for problem solving in environmental social science using the ConceptDraw DIAGRAM diagramming and vector drawing software extended with the Venn Diagrams solution from the area "Diagrams" of ConceptDraw Solution Park.
HelpDesk
How to Draw an Organizational Chart
Polish your diagram appearance using the tools provided in the Format panel. The organizational chart software is a valuable tool for modern business. It is important for any business to build a clear organizational structure that determines the responsibilities and relationships between different positions in the organization. The clear structured organization - means the clear structured business workflow, which is the core of success in the business. ConceptDraw DIAGRAM is an org chart software that allows you to draw an organizational structure of your company quickly and easily.HelpDesk
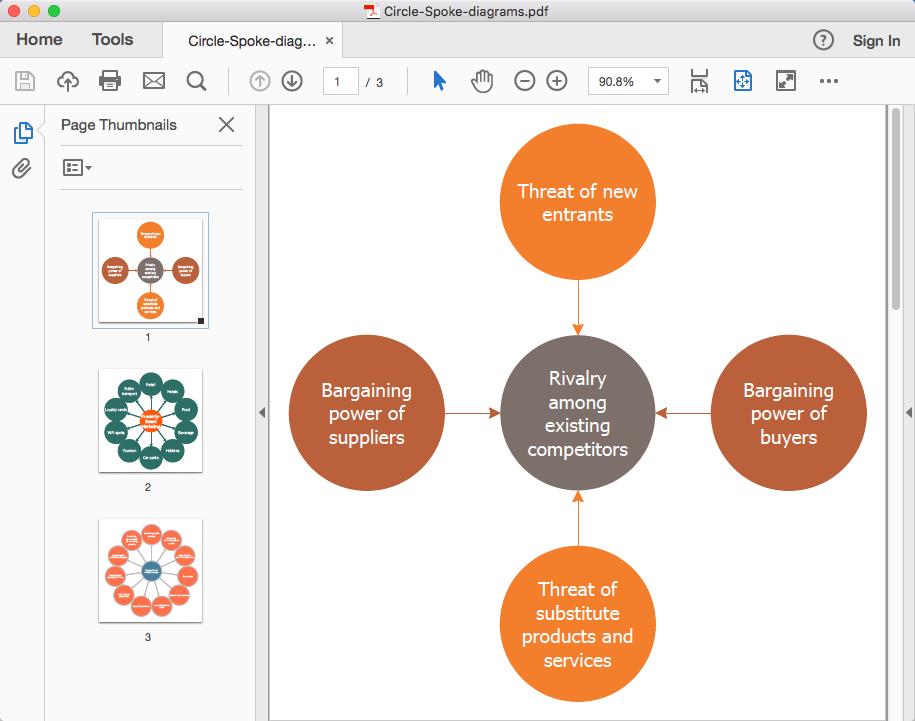
How To Convert a Circle-Spoke Diagram to Adobe PDF
ConceptDraw DIAGRAM allows you to easily share your marketing documentation between different computers with different operating systems and applications using its export capabilities. You can get your marketing diagrams in pdf format and avoid any problems while communicating them.- Circular Arrows Diagrams | Target and Circular Diagrams | Circular ...
- Business Diagram Software | Examples of Flowcharts, Org Charts ...
- Examples of Flowcharts, Org Charts and More | Business Diagram ...
- Org Chart Cross Functional Software Development Life Cycle
- Target and Circular Diagrams | Target Diagram | Daily Schedule ...
- Marketing | Six Markets Model Chart Template | Marketing Charts ...
- Organization Circle Diagram Chart
- Advantages Of Circular Organisation Chart
- Circular Chart In Organisation
- Picture Of Circular Organisational Chart
- Circle -Spoke Diagrams
- Daily Schedule Chart | Business diagrams & Org Charts with ...
- How to Draw an Organization Chart | Gant Chart in Project ...
- Marketing mix diagram
- Marketing Area | Target and Circular Diagrams | Marketing ...
- Marketing and Sales Organization chart . Organization chart ...
- ERD | Entity Relationship Diagrams, ERD Software for Mac and Win
- Flowchart | Basic Flowchart Symbols and Meaning
- Flowchart | Flowchart Design - Symbols, Shapes, Stencils and Icons
- Flowchart | Flow Chart Symbols
- Electrical | Electrical Drawing - Wiring and Circuits Schematics
- Flowchart | Common Flowchart Symbols