Examples of Flowcharts, Org Charts and More


Business Diagram Software


 Organizational Charts
Organizational Charts solution extends ConceptDraw PRO software with samples, templates and library of vector stencils for drawing the org charts.
 25 Typical Orgcharts
The 25 Typical Orgcharts solution contains powerful organizational structure and organizational management drawing tools, a variety of professionally designed organization chart and matrix organization structure samples, 25 templates based on various orga
Marketing Organization Chart

HelpDesk
How to Draw a Circular Arrows Diagram Using ConceptDraw PRO

 ConceptDraw Solution Park
ConceptDraw Solution Park collects graphic extensions, examples and learning materials
Draw Company Structure with Organization Charting Software

Draw Company Structure Diagram - get the detailed information about the company structure and hierarchy - who execute what tasks and who is in charge at this company. This information shows the reasoning and success of business and is indispensable for investors and financial institutions.

Basic Flowchart Symbols and Meaning


 Target and Circular Diagrams
This solution extends ConceptDraw PRO software with samples, templates and library of design elements for drawing the Target and Circular Diagrams.
Simple Drawing Applications for Mac

Basic Diagramming


Basic Diagramming


Basic Diagramming

Basic Diagramming

Steps of Accounting Cycle

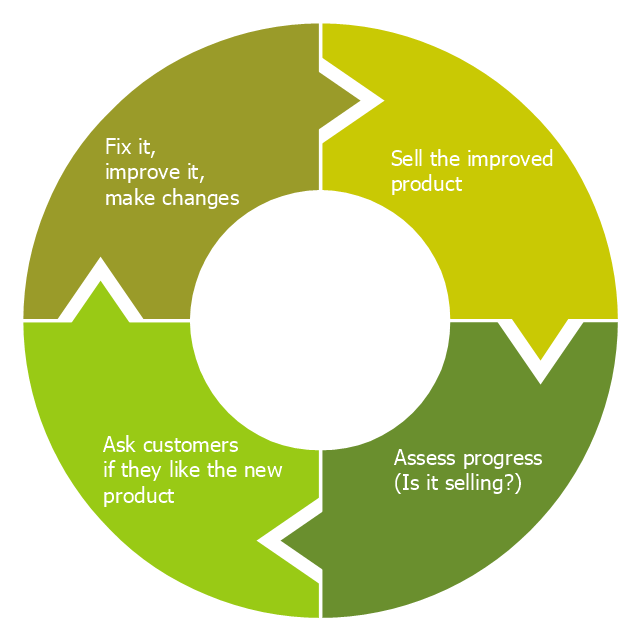
"Feedback is a process in which information about the past or the present influences the same phenomenon in the present or future. As part of a chain of cause-and-effect that forms a circuit or loop, the event is said to "feed back" into itself. ...
Feedback loop - the complete causal path that leads from the initial detection of the gap to the subsequent modification of the gap. ...
Feedback is commonly divided into two types - usually termed positive and negative. The terms can be applied in two contexts:
(1) the altering of the gap between reference and actual values of a parameter, based on whether the gap is widening (positive) or narrowing (negative),
(2) the valence of the action or effect that alters the gap, based on whether it has a happy (positive) or unhappy (negative) emotional connotation to the recipient or observer." [Feedback. Wikipedia]
This cycle diagram example was redesigned from the Wikimedia Commons file: Business Feedback Loop.jpg. [commons.wikimedia.org/ wiki/ File:Business_ Feedback_ Loop.jpg]
This file is made available under the Creative Commons CC0 1.0 Universal Public Domain Dedication. [creativecommons.org/ publicdomain/ zero/ 1.0/ deed.en]
The ring chart example "Business feedback loop" was created using the ConceptDraw PRO diagramming and vector drawing software extended with the Target and Circular Diagrams solution from the Marketing area of ConceptDraw Solution Park.
www.conceptdraw.com/ solution-park/ marketing-target-and-circular-diagrams
Ring chart
This arrow ring chart sample was created on the base of the figure illustrating the webpage "National Preparedness Cycle. Plan" from the Federal Emergency Management Agency (FEMA) website. "Planning makes it possible to manage the entire life cycle of a potential crisis. Strategic and operational planning establishes priorities, identifies expected levels of performance and capability requirements, provides the standard for assessing capabilities and helps stakeholders learn their roles. The planning elements identify what an organization’s Standard Operating Procedures (SOPs) or Emergency Operations Plans (EOPs) should include for ensuring that contingencies are in place for delivering the capability during a large-scale disaster." [fema.gov/ plan]
The arrow ring chart example "National Preparedness Cycle" was created using the ConceptDraw PRO diagramming and vector drawing software extended with the Target and Circular Diagrams solution from the Marketing area of ConceptDraw Solution Park.
www.conceptdraw.com/ solution-park/ marketing-target-and-circular-diagrams
Arrow ring chart
 Circular Arrows Diagrams
Circular Arrows Diagrams solution extends ConceptDraw PRO v10 with extensive drawing tools, predesigned samples, Circular flow diagram template for quick start, and a library of ready circular arrow vector stencils for drawing Circular Arrow Diagrams, Segmented Cycle Diagrams, and Circular Flow Diagrams. The elements in this solution help managers, analysts, business advisers, marketing experts, scientists, lecturers, and other knowledge workers in their daily work.
- Examples of Flowcharts, Org Charts and More
- Examples of Flowcharts, Org Charts and More | Business Diagram ...
- Circular Organisational Chart
- Picture Of Circular Organisational Chart
- Circular Organisation Chart
- Org Chart Cross Functional Software Development Life Cycle
- How to Draw an Organization Chart | Pie Chart Examples and ...
- How to Draw an Organization Chart | ConceptDraw PRO ...
- Target and Circular Diagrams | Business diagrams & Org Charts ...
- Marketing | Six Markets Model Chart Template | Target and Circular ...
- Basic Diagramming | Business diagrams & Org Charts with ...
- Marketing Diagrams | Marketing Charts | Marketing Organization ...
- Successful Strategic Plan | Strategic planning cycle - Arrow loop ...
- Target and Circular Diagrams | Target Diagram | Daily Schedule ...
- Marketing Diagrams | Marketing | Marketing and Sales Organization ...
- Cross-Functional Flowchart | Circular arrows diagram - BPM life ...
- ConceptDraw PRO - Organizational chart software | How to Create ...
- Circular Chart
- Target and Circular Diagrams | Target Diagram | Marketing ...
- Best Diagramming Software for Mac | Organization Chart Templates ...