UML Deployment Diagram. Design Elements

Basic Flowchart Symbols and Meaning


Venn Diagram

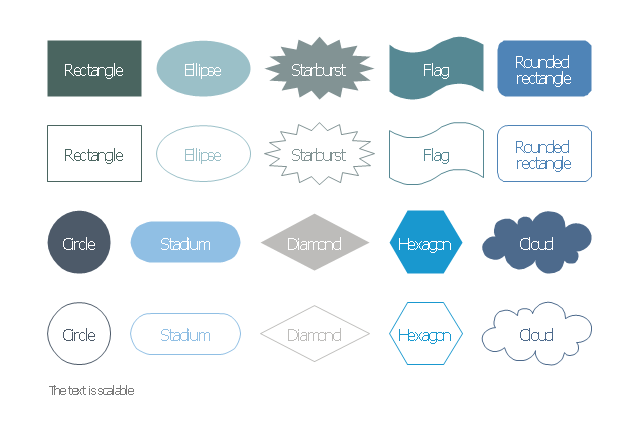
The vector stencils library "Management diagram" contains 20 solid and transparent geometric shapes: rectangle, rounded rectangle, ellipse, cloud, circle, diamond, hexagon, starburst, flag.
Use it to illustrate your management infograms with block diagrams.
"The term diagram in its commonly used sense can have a general or specific meaning:
(1) visual information device: Like the term "illustration" the diagram is used as a collective term standing for the whole class of technical genres, including graphs, technical drawings and tables.
(2) specific kind of visual display: This is the genre that shows qualitative data with shapes that are connected by lines, arrows, or other visual links. ...
In the specific sense diagrams and charts contrast with computer graphics, technical illustrations, infographics, maps, and technical drawings, by showing "abstract rather than literal representations of information". The essence of a diagram can be seen as:
(1) a form of visual formatting devices;
(2) a display that does not show quantitative data (numerical data), but rather relationships and abstract information;
(3) with building blocks such as geometrical shapes connected by lines, arrows, or other visual links." [Diagram. Wikipedia]
The shapes example "Design elements - Management diagram" was created using the ConceptDraw PRO diagramming and vector drawing software extended with the Management Infographics solition from the area "Business Infographics" in ConceptDraw Solution Park.
Management diagram
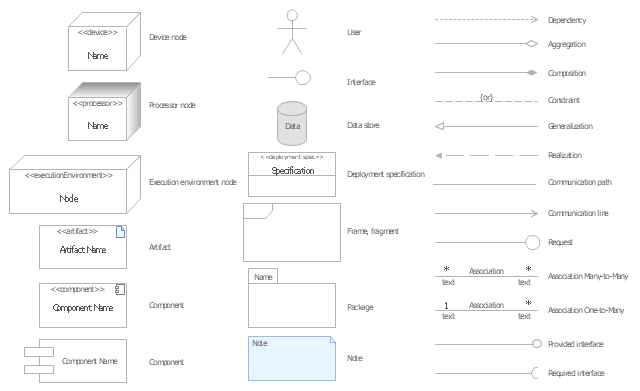
The vector stencils library "Bank UML deployment diagram" contains 10 shapes for drawing UML deployment diagrams.
Use it for object-oriented modeling of your bank information system.
"A deployment diagram in the Unified Modeling Language models the physical deployment of artifacts on nodes. To describe a web site, for example, a deployment diagram would show what hardware components ("nodes") exist (e.g., a web server, an application server, and a database server), what software components ("artifacts") run on each node (e.g., web application, database), and how the different pieces are connected (e.g. JDBC, REST, RMI).
The nodes appear as boxes, and the artifacts allocated to each node appear as rectangles within the boxes. Nodes may have subnodes, which appear as nested boxes. A single node in a deployment diagram may conceptually represent multiple physical nodes, such as a cluster of database servers.
There are two types of Nodes:
1. Device Node.
2. Execution Environment Node.
Device nodes are physical computing resources with processing memory and services to execute software, such as typical computers or mobile phones. An execution environment node (EEN) is a software computing resource that runs within an outer node and which itself provides a service to host and execute other executable software elements." [Deployment diagram. Wikipedia]
This example of UML deployment diagram symbols for the ConceptDraw PRO diagramming and vector drawing software is included in the ATM UML Diagrams solution from the Software Development area of ConceptDraw Solution Park.
UML deployment diagram symbols

Cross-Functional Flowchart


UML Diagram for Mac

Cisco Multimedia, Voice, Phone. Cisco icons, shapes, stencils and symbols
")
The vector stencils library "UML deployment diagrams" contains 31 symbols for the ConceptDraw PRO diagramming and vector drawing software.
"A deployment diagram in the Unified Modeling Language models the physical deployment of artifacts on nodes. ...
The nodes appear as boxes, and the artifacts allocated to each node appear as rectangles within the boxes. Nodes may have subnodes, which appear as nested boxes. A single node in a deployment diagram may conceptually represent multiple physical nodes, such as a cluster of database servers.
There are two types of Nodes.
(1) Device Node.
(2) Execution Environment Node." [Deployment diagram. Wikipedia]
The example "Design elements - UML deployment diagrams" is included in the Rapid UML solution from the Software Development area of ConceptDraw Solution Park.
UML deployment diagram symbols
 Divided Bar Diagrams
The Divided Bar Diagrams Solution extends the capabilities of ConceptDraw PRO v10 with templates, samples, and a library of vector stencils for drawing high impact and professional Divided Bar Diagrams and Graphs, Bar Diagram Math, and Stacked Graph.
UML Notation

Data Flow Diagram (DFD)
")
UML Diagram

How to Make Audio and Video Connections

Check Order Process Flowchart. Flowchart Examples

- Divided Rectangles To Represent Data
- How To Drow Rectangle Divide Diagram
- How to Draw a Divided Bar Chart in ConceptDraw PRO | Divided ...
- Diagram Of Divided Rectangles
- Representing Data On Divided Rectangles
- Basic Flowchart Symbols and Meaning | UML Activity Diagram ...
- Components of ER Diagram | ERD Symbols and Meanings | Entity ...
- What Is Divide Bar Graph
- UML Diagram | Design elements - Bank UML deployment diagram ...
- Entity Relationship Diagram - ERD - Software for Design Crows Foot ...
- Decision Making | Influence Diagram | Influence Diagram Software ...
- UML Deployment Diagram Example
- Graph Divide Rectangle
- UML Deployment Diagram | Design elements - Bank UML ...
- UML Deployment Diagram . Design Elements | UML Component ...
- UML Deployment Diagram Example - ATM System UML diagrams ...
- Influence Diagram Software | Influence Diagram | CORRECTIVE ...
- LDAP - Vector stencils library | Logical network diagram - Vector ...
- ConceptDraw PRO ER Diagram Tool | Entity-Relationship Diagram ...
- Euclidean algorithm - Flowchart | Flow Chart For Greatest Common ...