Banking System
DFD Library System

Bank Sequence Diagram

Model Based Systems Engineering

UML Deployment Diagram
Use ConceptDraw DIAGRAM with UML deployment diagram templates, samples and stencil library from Rapid UML solution to model the physical deployment of artifacts on nodes of your software system.

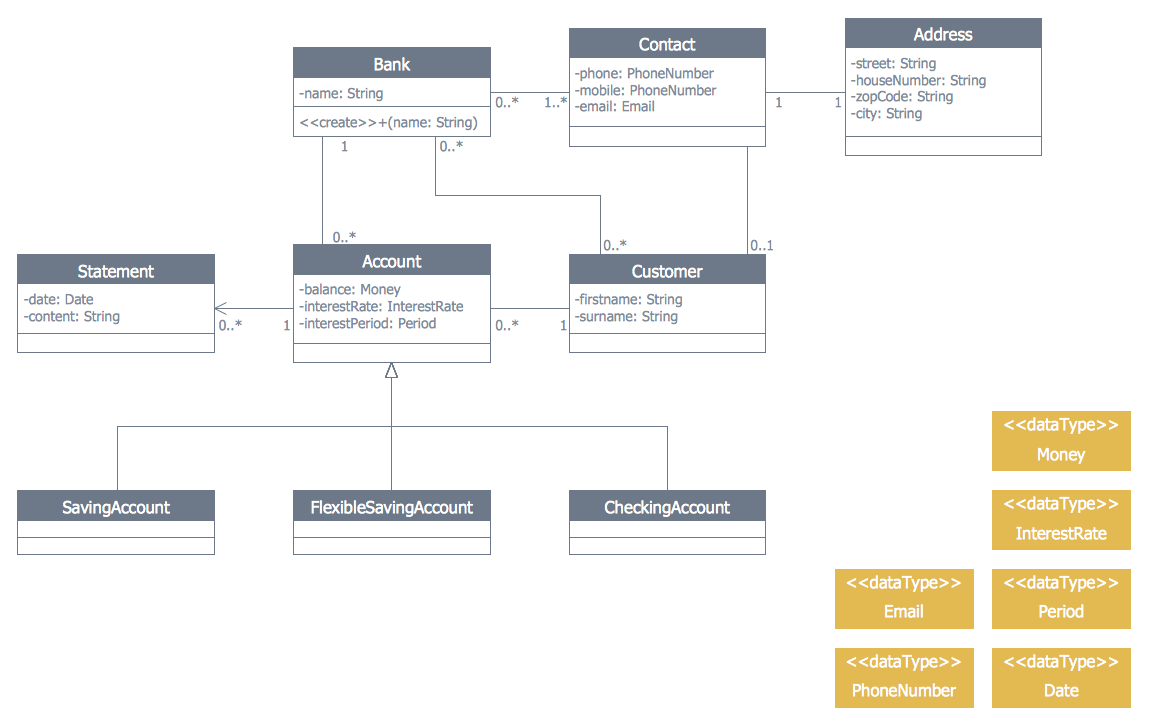
Bank UML Diagram
Structured Systems Analysis and Design Method (SSADM) with ConceptDraw DIAGRAM

ATM Solutions
Design Elements for UML Diagrams
Yourdon and Coad Diagram

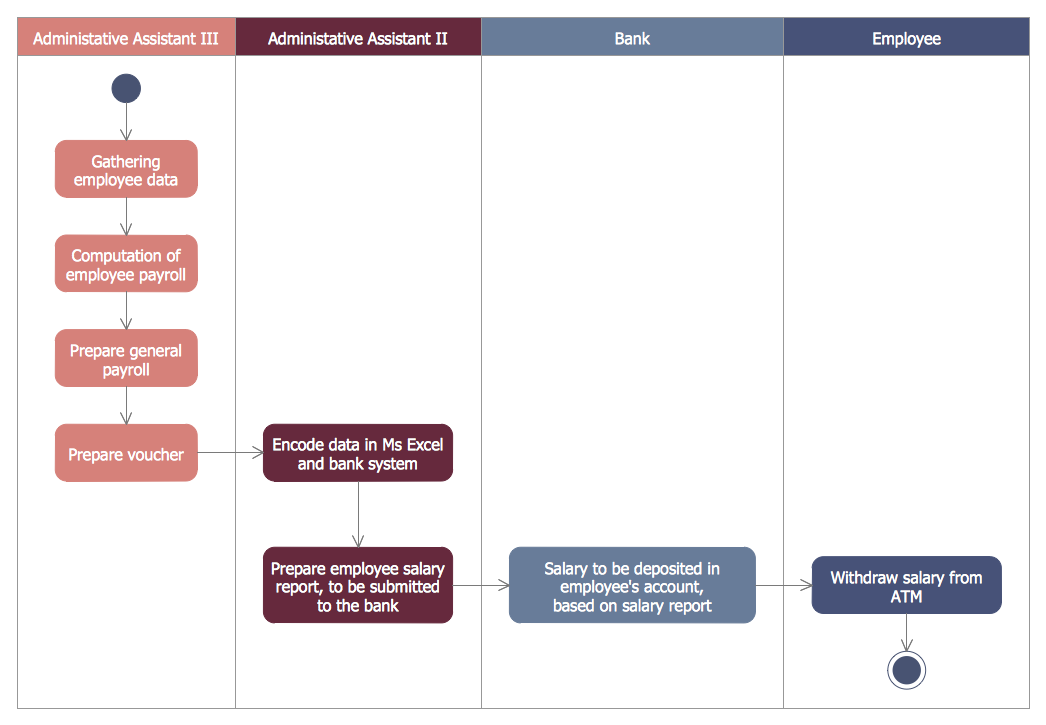
UML Activity Diagram

Use ConceptDraw DIAGRAM diagramming and vector drawing software enhanced with Rapid UML solution from ConceptDraw Solution Park to create your own UML activity diagrams that show the business and operational workflows of components and overall flow of control in your systems. Such software provides coloring UML diagrams for various purposes and simplifying work of the engineers.
Account Flowchart Stockbridge System. Flowchart Examples

This is a flowchart of a data processing system combining manual and computerized processing to handle accounts receivable, billing, and general ledger.
UML Component Diagram Example - Online Shopping

This sample shows the concept of the online shopping and is used for the understanding of the online shopping processes, of the online shops working processes, for projection and creating of the online stores.
Data Flow Diagram

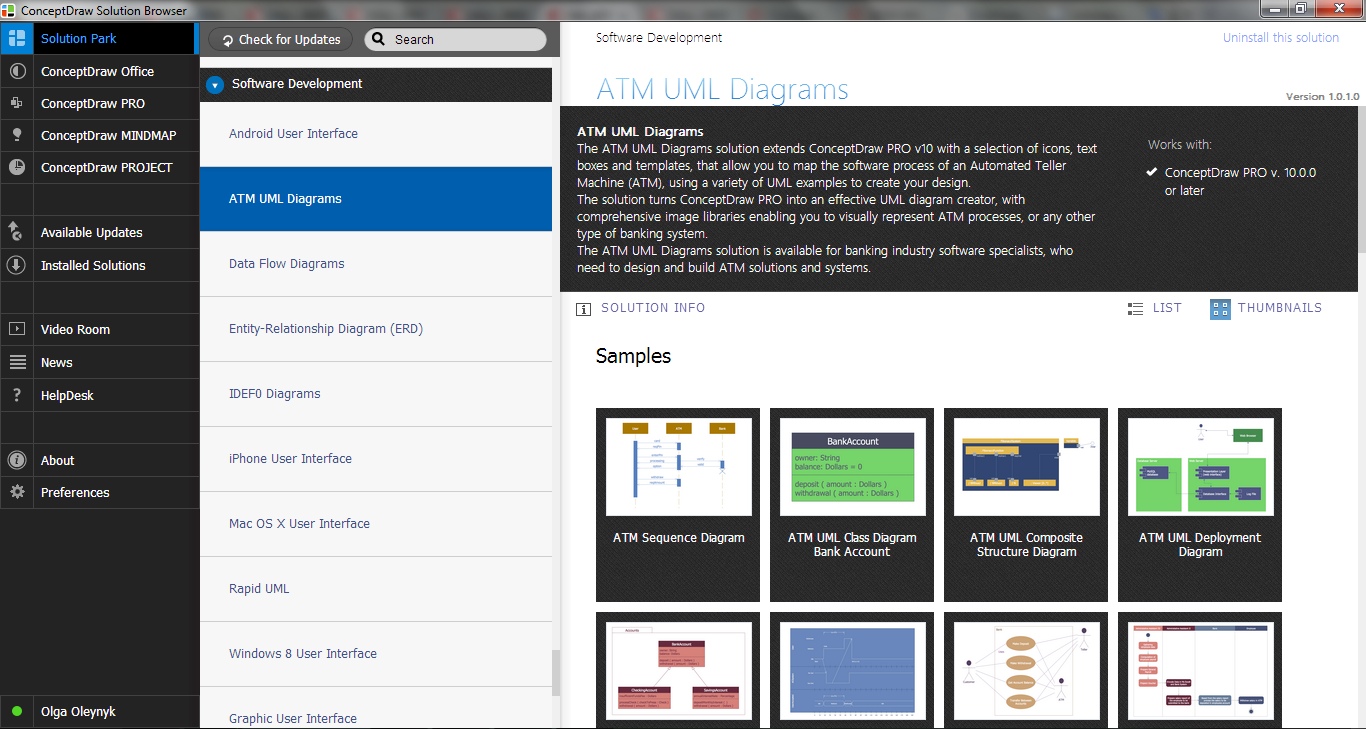
 ATM UML Diagrams
The ATM UML Diagrams solution lets you create ATM solutions and UML examples. Use ConceptDraw DIAGRAM as a UML diagram creator to visualize a banking system.
- Bank Transaction Dfd
- DFD - Process of account receivable | Class UML Diagram for Bank ...
- Data Flow Diagrams ( DFD ) | ATM UML Diagrams | Banking System ...
- UML use case diagram - Banking system | Data Flow Diagram ...
- Data Flow Diagram For Bank Transaction
- Dfd Diagram For Banking Transaction System
- Er Diagram For A Banking Transaction System
- DFD Library System | Data Flow Diagrams ( DFD ) | IDEF0 Diagrams ...
- DFD Library System | UML use case diagram - Banking system ...
- Draw Dfd On Banking System
- ATM UML Diagrams | DFD Library System | Data Flow Diagram | Dfd ...
- UML use case diagram - Banking system | Data Flow Diagram ...
- Dfd Of Atm Transaction System
- DFD Library System | Data Flow Diagram | UML Component ...
- DFD Library System | ATM UML Diagrams | Accounting Flowchart ...
- UML Activity Diagram | Bank System | Banking System | Activity ...
- Bank System | Banking System | UML use case diagram - Banking ...
- DFD Library System | Account Flowchart Stockbridge System ...
- Data Flow Diagram For Banking Transaction
- UML use case diagram - Banking system | UML Deployment ...
- ERD | Entity Relationship Diagrams, ERD Software for Mac and Win
- Flowchart | Basic Flowchart Symbols and Meaning
- Flowchart | Flowchart Design - Symbols, Shapes, Stencils and Icons
- Flowchart | Flow Chart Symbols
- Electrical | Electrical Drawing - Wiring and Circuits Schematics
- Flowchart | Common Flowchart Symbols
- Flowchart | Common Flowchart Symbols