Decision Making Software For Small Business


, t chart, decision matrix, decision tree analysis") Decision Making
Decision Making
The Decision Making solution offers the set of professionally developed examples, powerful drawing tools and a wide range of libraries with specific ready-made vector decision icons, decision pictograms, decision flowchart elements, decision tree icons, decision signs arrows, and callouts, allowing the decision maker (even without drawing and design skills) to easily construct Decision diagrams, Business decision maps, Decision flowcharts, Decision trees, Decision matrix, T Chart, Influence diagrams, which are powerful in questions of decision making, holding decision tree analysis and Analytic Hierarchy Process (AHP), visual decomposition the decision problem into hierarchy of easily comprehensible sub-problems and solving them without any efforts.
Decision Making


How To Make the Right Decision in Projects

Best Software for Making Presentations

Decision Tree Analysis

The ConceptDraw DIAGRAM diagramming and drawing software is the one that can help with creating the needed drawing, including a decision tree. Making decision tree analysis, it is always easy to make the needed matrix as there are plenty of pre-made templates to be used.
A four level pyramid model of different types of Information Systems based on the different levels of hierarchy in an organization. The first level represents transaction processing systems for workers. The second level represents management information systems for middle managers. The third level represents decision support systems for senior menegers. The fourth level represents executive information systems for executives.
"The "classic" view of Information systems found in the textbooks in the 1980s was of a pyramid of systems that reflected the hierarchy of the organization, usually transaction processing systems at the bottom of the pyramid, followed by management information systems, decision support systems, and ending with executive information systems at the top. Although the pyramid model remains useful, since it was first formulated a number of new technologies have been developed and new categories of information systems have emerged, some of which no longer fit easily into the original pyramid model.
Some examples of such systems are:
data warehouses,
enterprise resource planning,
enterprise systems,
expert systems,
search engines,
geographic information system,
global information system,
office automation." [Information systems. Wikipedia]
This diagram was redesigned using the ConceptDraw PRO diagramming and vector drawing software from Wikimedia Commons file Four-Level-Pyramid-model.png. [commons.wikimedia.org/ wiki/ File:Four-Level-Pyramid-model.png]
This file is licensed under the Creative Commons Attribution-Share Alike 3.0 Unported license. [creativecommons.org/ licenses/ by-sa/ 3.0/ deed.en]
The triangle chart example "Information systems types" is included in the Pyramid Diagrams solution from the Marketing area of ConceptDraw Solution Park.
Pyramid diagram

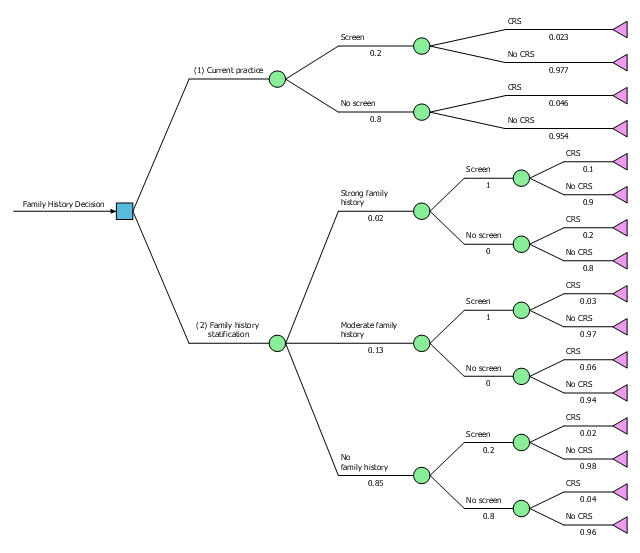
This example was designed on the base of Figure 4.33 "Decision Tree Comparing Colorectal Screening Current Practice with a Targeted Family History Strategy" from the "Principles of Epidemiology in Public Health Practice, Third Edition. An Introduction to Applied Epidemiology and Biostatistics. Self-Study Course SS1978. Lesson 4: Displaying Public Health Data. Section 4: Other Data Displays" on the Centers for Disease Control and Prevention (CDC) website.
"The graph shows a decision tree with outcomes, and probabilities. In this case, a family history decision tree has 16 potential outcomes."
[cdc.gov/ ophss/ csels/ dsepd/ ss1978/ lesson4/ section4.html]
"A decision tree is a decision support tool that uses a tree-like graph or model of decisions and their possible consequences, including chance event outcomes, resource costs, and utility. It is one way to display an algorithm that only contains conditional control statements.
Decision trees are commonly used in operations research, specifically in decision analysis, to help identify a strategy most likely to reach a goal, but are also a popular tool in machine learning." [Decision tree. Wikipedia]
The diagram example "Decision tree" was designed using ConceptDraw software extended with Decision Making solution from Management area of ConceptDraw Solution Park.
Decision diagram example
HelpDesk
How to Draw a Decision-Making Diagram

A five level pyramid model of different types of Information Systems based on the information processing requirement of different levels in the organization. The first level represents transaction processing systems to process basic data. The second level represents office support systems to process information in office. The third level represents management information systems to process information by managers. The fourth level represents decision support systems to process explicit knowledge. The fifth level represents executive information systems to process tacit knowledge.
"A Computer(-Based) Information System is essentially an IS using computer technology to carry out some or all of its planned tasks. The basic components of computer based information system are:
(1) Hardware - these are the devices like the monitor, processor, printer and keyboard, all of which work together to accept, process, show data and information.
(2) Software - are the programs that allow the hardware to process the data.
(3) Databases - are the gathering of associated files or tables containing related data.
(4) Networks - are a connecting system that allows diverse computers to distribute resources.
(5) Procedures - are the commands for combining the components above to process information and produce the preferred output.
The first four components (hardware, software, database and network) make up what is known as the information technology platform. Information technology workers could then use these components to create information systems that watch over safety measures, risk and the management of data. These actions are known as information technology services." [Information systems. Wikipedia]
This pyramid diagram was redesigned using the ConceptDraw PRO diagramming and vector drawing software from Wikimedia Commons file Five-Level-Pyramid-model.png. [commons.wikimedia.org/ wiki/ File:Five-Level-Pyramid-model.png]
This file is licensed under the Creative Commons Attribution 3.0 Unported license. [creativecommons.org/ licenses/ by/ 3.0/ deed.en]
The triangle chart example "Information systems types" is included in the Pyramid Diagrams solution from the Marketing area of ConceptDraw Solution Park.
Pyramid diagram

 MindWave for SAP Streamworks
ConceptDraw MindWave for SAP StreamWork allows you to visualize the process of collaboration, increase effectiveness of team work, prepare supporting presentations and achieve ready-to-use documents.
Presentation Preparation using Mind Maps

The Best Productivity Software

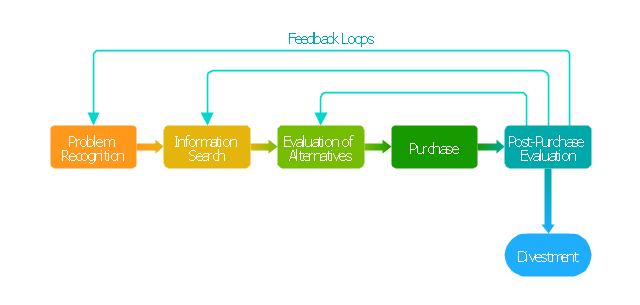
"Decision-making can be regarded as the cognitive process resulting in the selection of a belief and/ or a course of action among several alternative possibilities. Every decision-making process produces a final choice that may or may not prompt action. ...
Decision-making can also be regarded as a problem-solving activity terminated by a solution deemed to be satisfactory. It is, therefore, a reasoning or emotional process which can be rational or irrational and can be based on explicit assumptions or tacit assumptions. Most decisions are followed by some form of cost-benefit analysis. Rational choice theory encompasses the notion that people try to maximize benefits while minimizing costs.
Some have argued that most decisions are made unconsciously, if not involuntarily. Jim Nightingale, author of Think Smart – Act Smart, states that "we simply decide without thinking much about the decision process. ...
A major part of decision-making involves the analysis of a finite set of alternatives described in terms of evaluative criteria. Information overload occurs when there is a substantial gap between the capacity of information and the ways in which people may or can adapt."" [Decision-making. Wikipedia]
The block diagram example "Customer decision making" was created using the ConceptDraw PRO diagramming and vector drawing software extended with the Block Diagrams solution from the area "What is a Diagram" of ConceptDraw Solution Park.
Block diagram
Organization Chart Software: A Comprehensive Guide


A Tool for EffectiveTeam Meetings

Decision Maker

- Design elements | Flowchart Of Decision Support System
- Decision Tree Analysis
- 4 Level pyramid model diagram - Information systems types | 5 Level ...
- Decision Making | Organization Chart Software : A Comprehensive ...
- 4 Level pyramid model diagram - Information systems types | 5 Level ...
- Process Flowchart | Describe The Decision Support System And ...
- Education Information - Information systems types
- Decision Making | Decision tree | Influence Diagram | Decision ...
- 4 Level pyramid model diagram - Information systems types | 5 Level ...
- 4 Level pyramid model diagram - Information systems types | Basic ...