HelpDesk
Event-driven Process Chain (EPC) Diagram Software

Control and Information Architecture Diagrams (CIAD) with ConceptDraw PRO

A four level pyramid model of different types of Information Systems based on the different levels of hierarchy in an organization. The first level represents transaction processing systems for workers. The second level represents management information systems for middle managers. The third level represents decision support systems for senior menegers. The fourth level represents executive information systems for executives.
"The "classic" view of Information systems found in the textbooks in the 1980s was of a pyramid of systems that reflected the hierarchy of the organization, usually transaction processing systems at the bottom of the pyramid, followed by management information systems, decision support systems, and ending with executive information systems at the top. Although the pyramid model remains useful, since it was first formulated a number of new technologies have been developed and new categories of information systems have emerged, some of which no longer fit easily into the original pyramid model.
Some examples of such systems are:
data warehouses,
enterprise resource planning,
enterprise systems,
expert systems,
search engines,
geographic information system,
global information system,
office automation." [Information systems. Wikipedia]
This diagram was redesigned using the ConceptDraw PRO diagramming and vector drawing software from Wikimedia Commons file Four-Level-Pyramid-model.png. [commons.wikimedia.org/ wiki/ File:Four-Level-Pyramid-model.png]
This file is licensed under the Creative Commons Attribution-Share Alike 3.0 Unported license. [creativecommons.org/ licenses/ by-sa/ 3.0/ deed.en]
The triangle chart example "Information systems types" is included in the Pyramid Diagrams solution from the Marketing area of ConceptDraw Solution Park.
Pyramid diagram

A five level pyramid model of different types of Information Systems based on the information processing requirement of different levels in the organization. The first level represents transaction processing systems to process basic data. The second level represents office support systems to process information in office. The third level represents management information systems to process information by managers. The fourth level represents decision support systems to process explicit knowledge. The fifth level represents executive information systems to process tacit knowledge.
"A Computer(-Based) Information System is essentially an IS using computer technology to carry out some or all of its planned tasks. The basic components of computer based information system are:
(1) Hardware - these are the devices like the monitor, processor, printer and keyboard, all of which work together to accept, process, show data and information.
(2) Software - are the programs that allow the hardware to process the data.
(3) Databases - are the gathering of associated files or tables containing related data.
(4) Networks - are a connecting system that allows diverse computers to distribute resources.
(5) Procedures - are the commands for combining the components above to process information and produce the preferred output.
The first four components (hardware, software, database and network) make up what is known as the information technology platform. Information technology workers could then use these components to create information systems that watch over safety measures, risk and the management of data. These actions are known as information technology services." [Information systems. Wikipedia]
This pyramid diagram was redesigned using the ConceptDraw PRO diagramming and vector drawing software from Wikimedia Commons file Five-Level-Pyramid-model.png. [commons.wikimedia.org/ wiki/ File:Five-Level-Pyramid-model.png]
This file is licensed under the Creative Commons Attribution 3.0 Unported license. [creativecommons.org/ licenses/ by/ 3.0/ deed.en]
The triangle chart example "Information systems types" is included in the Pyramid Diagrams solution from the Marketing area of ConceptDraw Solution Park.
Pyramid diagram

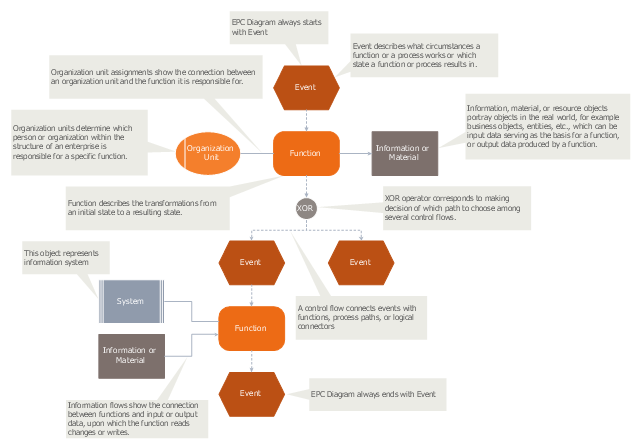
"An Event-driven Process Chain (EPC) is a type of flowchart used for business process modelling. Event-driven Process Chains can be used for configuring an enterprise resource planning (ERP) implementation, and for business process improvement. ...
Businesses use Event-driven Process Chain diagrams to lay out business process work flows, originally in conjunction with SAP R/ 3 modeling, but now more widely. It is used by many companies for modeling, analyzing, and redesigning business processes. The Event-driven Process Chain method was developed within the framework of Architecture of Integrated Information Systems (ARIS). As such it forms the core technique for modeling in ARIS, which serves to link the different views in the so-called control view." [Event-driven process chain. Wikipedia]
The event-driven process chain (EPC) diagram template for the ConceptDraw PRO diagramming and vector drawing software is included in the Event-driven Process Chain Diagrams solution from the Business Processes area of ConceptDraw Solution Park.
EPC diagram template
HelpDesk
Accounting Information Systems Flowchart Symbols

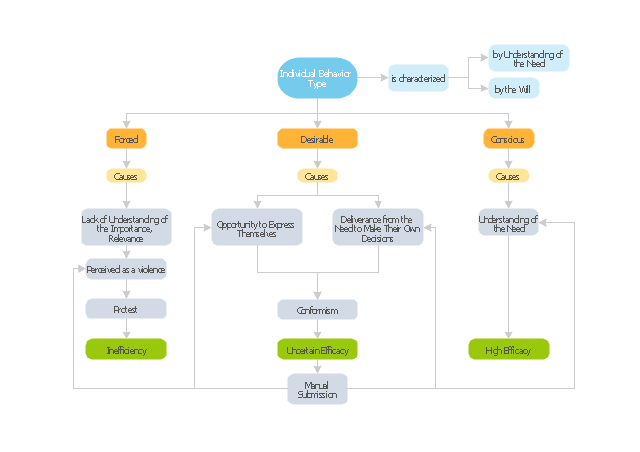
"Organizational behavior is a field of study that investigates the impact that individuals, groups and structures have on behavior within an organization for the purpose of applying such knowledge towards improving an organization's effectiveness. It is an interdisciplinary field that includes sociology, psychology, communication, and management; and it complements the academic studies of organizational theory (which is focused on organizational and intra-organizational topics) and human resource studies (which is more applied and business-oriented). It may also be referred to as organizational studies or organizational science." [Organizational behavior. Wikipedia]
The block diagram example "Types of individual behavior in organization" was created using the ConceptDraw PRO diagramming and vector drawing software extended with the Block Diagrams solution from the area "What is a Diagram" of ConceptDraw Solution Park.
The block diagram example "Types of individual behavior in organization" was created using the ConceptDraw PRO diagramming and vector drawing software extended with the Block Diagrams solution from the area "What is a Diagram" of ConceptDraw Solution Park.
Block diagram
Garrett IA Diagrams with ConceptDraw PRO

- 4 Level pyramid model diagram - Information systems types | 5 Level ...
- Chart Of Management Information System With Diagram
- | Pyramid Diagram | | Management Information System
- Process Flowchart | 4 Level pyramid model diagram - Information ...
- 4 Level pyramid model diagram - Information systems types ...
- Block diagram - Types of individual behavior in organization ...
- 3 level pyramid model diagram of information systems types | 4 level ...
- Information System Are Various Levels Of The Organizational ...
- Pyramid Diagram | Organizational Structure | Types of Flowcharts ...
- How to Create Flowcharts for an Accounting Information System ...
- Pyramid Diagram | 4 Level pyramid model diagram - Information ...
- Pyramid Diagram | Pyramid Diagram | 25 Typical Orgcharts | 3 Level ...
- Pyramid Diagram | Pyramid Diagram | Organizational Structure | A ...
- 5 Level pyramid model diagram - Information systems types | 4 Level ...
- Pyramid Diagram | 4 Level pyramid model diagram - Information ...
- Dfd Diagram For The University Information System
- Pyramid Diagram
- Pyramid Diagram | 4 Level pyramid model diagram - Information ...
- Organizational Structure | Control and Information Architecture ...
- Pyramid Diagram | 4 Level pyramid model diagram - Information ...