HelpDesk
Event-driven Process Chain (EPC) Diagram Software

A four level pyramid model of different types of Information Systems based on the different levels of hierarchy in an organization. The first level represents transaction processing systems for workers. The second level represents management information systems for middle managers. The third level represents decision support systems for senior menegers. The fourth level represents executive information systems for executives.
"The "classic" view of Information systems found in the textbooks in the 1980s was of a pyramid of systems that reflected the hierarchy of the organization, usually transaction processing systems at the bottom of the pyramid, followed by management information systems, decision support systems, and ending with executive information systems at the top. Although the pyramid model remains useful, since it was first formulated a number of new technologies have been developed and new categories of information systems have emerged, some of which no longer fit easily into the original pyramid model.
Some examples of such systems are:
data warehouses,
enterprise resource planning,
enterprise systems,
expert systems,
search engines,
geographic information system,
global information system,
office automation." [Information systems. Wikipedia]
This diagram was redesigned using the ConceptDraw PRO diagramming and vector drawing software from Wikimedia Commons file Four-Level-Pyramid-model.png. [commons.wikimedia.org/ wiki/ File:Four-Level-Pyramid-model.png]
This file is licensed under the Creative Commons Attribution-Share Alike 3.0 Unported license. [creativecommons.org/ licenses/ by-sa/ 3.0/ deed.en]
The triangle chart example "Information systems types" is included in the Pyramid Diagrams solution from the Marketing area of ConceptDraw Solution Park.
Pyramid diagram

A five level pyramid model of different types of Information Systems based on the information processing requirement of different levels in the organization. The first level represents transaction processing systems to process basic data. The second level represents office support systems to process information in office. The third level represents management information systems to process information by managers. The fourth level represents decision support systems to process explicit knowledge. The fifth level represents executive information systems to process tacit knowledge.
"A Computer(-Based) Information System is essentially an IS using computer technology to carry out some or all of its planned tasks. The basic components of computer based information system are:
(1) Hardware - these are the devices like the monitor, processor, printer and keyboard, all of which work together to accept, process, show data and information.
(2) Software - are the programs that allow the hardware to process the data.
(3) Databases - are the gathering of associated files or tables containing related data.
(4) Networks - are a connecting system that allows diverse computers to distribute resources.
(5) Procedures - are the commands for combining the components above to process information and produce the preferred output.
The first four components (hardware, software, database and network) make up what is known as the information technology platform. Information technology workers could then use these components to create information systems that watch over safety measures, risk and the management of data. These actions are known as information technology services." [Information systems. Wikipedia]
This pyramid diagram was redesigned using the ConceptDraw PRO diagramming and vector drawing software from Wikimedia Commons file Five-Level-Pyramid-model.png. [commons.wikimedia.org/ wiki/ File:Five-Level-Pyramid-model.png]
This file is licensed under the Creative Commons Attribution 3.0 Unported license. [creativecommons.org/ licenses/ by/ 3.0/ deed.en]
The triangle chart example "Information systems types" is included in the Pyramid Diagrams solution from the Marketing area of ConceptDraw Solution Park.
Pyramid diagram

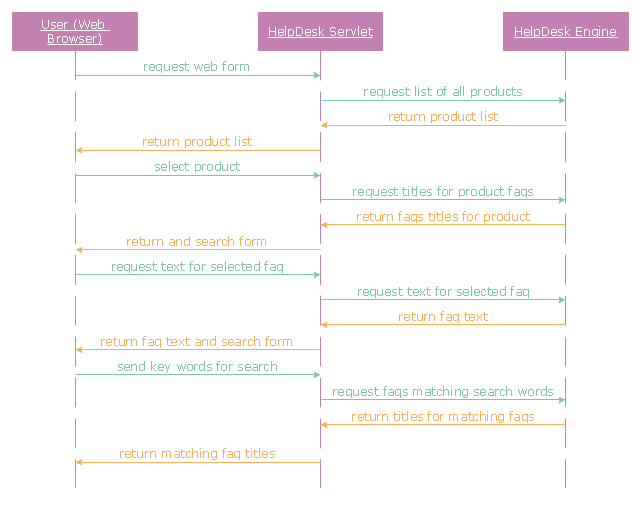
"A help desk is a resource intended to provide the customer or end user with information and support related to a company's or institution's products and services. The purpose of a help desk is usually to troubleshoot problems or provide guidance about products such as computers, electronic equipment, food, apparel, or software. Corporations usually provide help desk support to their customers through various channels such as toll-free numbers, websites, instant messaging, or email. There are also in-house help desks designed to provide assistance to employees." [Help desk. Wikipedia]
The UML sequence diagram example "Help desk" was created using the ConceptDraw PRO diagramming and vector drawing software extended with the Rapid UML solution from the Software Development area of ConceptDraw Solution Park.
The UML sequence diagram example "Help desk" was created using the ConceptDraw PRO diagramming and vector drawing software extended with the Rapid UML solution from the Software Development area of ConceptDraw Solution Park.
UML sequence diagram
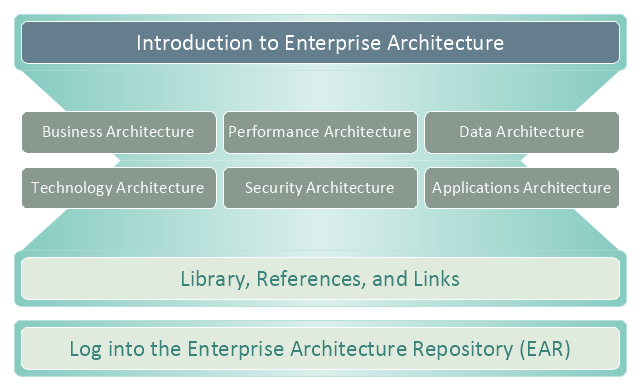
This enterprise architecture diagram sample was drawn on the base of the figure illustrating the webpage "Enterprise Architecture" from the United States Department of Agriculture (USDA) website.
"The USDA's Enterprise Architecture program strategically partners with all agencies to provide value to USDA's mission areas, business processes, and Information Technology (IT) capabilities.
Introduction.
The USDA Enterprise Architecture (EA) helps make sure information technology investments align with the mission and goals of the Department. It defines how information and technology should support USDA’s strategic goals and benefit the business.
Purpose.
The intent of the USDA Enterprise Architecture is to help make the information technology (IT) expenditures more effectively serve the mission and goals of the organization. Enterprise architecture defines how information and technology support USDA’s strategic planning to benefit our business. There are many ways to organize the information and diagrams that make up the architecture."
[ocio.usda.gov/ about-ocio/ governance-and-strategic-investment-gsi/ enterprise-architecture]
The enterprise architecture diagram example "USDA's Enterprise Architecture" was created using the ConceptDraw PRO diagramming and vector drawing software extended with the Enterprise Architecture Diagrams solution from the Management area of ConceptDraw Solution Park.
Enterprise architecture diagram
 ConceptDraw Solution Park
ConceptDraw Solution Park collects graphic extensions, examples and learning materials
HelpDesk
How to Create an IDEF0 Diagram for an Application Development

- 4 Level pyramid model diagram - Information systems types | 5 Level ...
- Chart Of Management Information System With Diagram
- 4 Level pyramid model diagram - Information systems types | 5 Level ...
- | Pyramid Diagram | | Management Information System
- 5 Level pyramid model diagram - Information systems types | PM ...
- 4 Level pyramid model diagram - Information systems types | 5 Level ...
- Business Support System Block Diagram
- 3 Level pyramid model diagram - Information systems types | 5 Level ...
- Pyramid Diagram | 5 Level pyramid model diagram - Information ...
- 4 Level pyramid model diagram - Information systems types ...
- 4 Level pyramid model diagram - Information systems types ...
- Management Information System Triangle Diagram
- 3 level pyramid model diagram of information systems types | 4 level ...
- Pyramid Diagram | 3 Level pyramid model diagram - Information ...
- 4 Level pyramid model diagram - Information systems types | 5 Level ...
- Block Diagram For Business Support System
- 5 Level pyramid model diagram - Information systems types
- Pyramid Diagram | 4 Level pyramid model diagram - Information ...
- 4 Level pyramid model diagram - Information systems types ...
- 5 Level pyramid model diagram - Information systems types | 4 Level ...