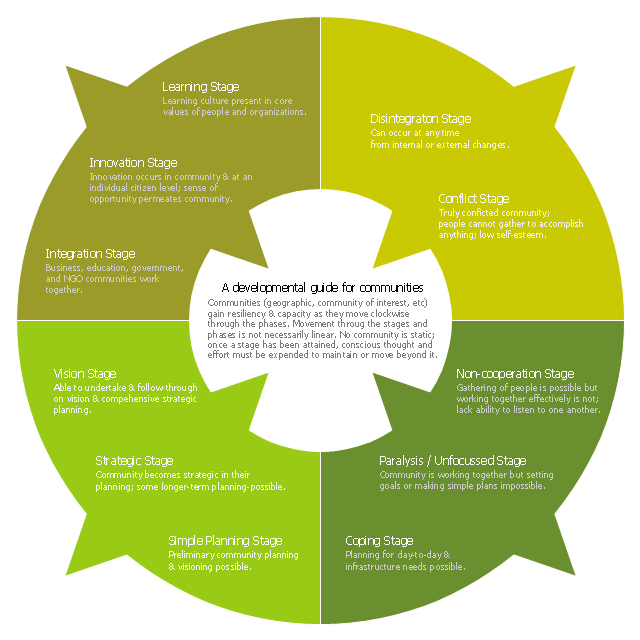
This ring chart sample was created on the base of the figure illustrating the "CCP Handbook - Comprehensive Community Planning for First Nations in British Columbia" from the Government of Canada website. "Tool 1: Centre for Innovative & Entrepreneurial Leadership (CIEL) Community Life Cycle Matrix.
Actualization Phase.
Community is highly developed and encourages learning & innovation while respecting history and culture. Community shares resources with others and regularly monitors itself, continuing to enhance capacity.
Action: Community undertakes regular reviews and reflection activities to maintain or enhance stage / phase.
Pre-Community or Chaos Phase.
Community is undeveloped. Limited sharing of resources or recognition of value of a community.
Action: Community can (re)form through the identification of and action of influential and respected leaders (elected or unelected).
Vision Phase.
Community recognizes the importance of vision and long-term planning; is able to move in this direction.
Action: Community can engage in planning, meaningful consultation of its members, & working towards the development of strategic thinking & planning, and, ultimately, identifying community-wide values, distinct community characteristics and a vision.
Emergence Phase.
Community exists but has significant problems, making anything but survival & fulfilling short-term needs impossible.
Action: Community can advance through focus on small, non-political, trustbuilding projects to build success, respect, confidence, relationships & skills.
Why the Matrix.
The challenge of developing innovative and entrepreneurial communities is in ensuring that the communities have a clear picture of where they are at and where they want to go. This enables a better match of the tools available with both the capacity of the community and the hoped for goal. For example, while strategic planning may work for some communities, the planning process may also lead to frustration and failure in other communities that do not have the necessary trust, social capital or capacity." [aadnc-aandc.gc.ca/ eng/ 1100100021972/ 1100100022090]
The ring chart example "Community life cycle matrix" was created using the ConceptDraw PRO diagramming and vector drawing software extended with the Target and Circular Diagrams solution from the Marketing area of ConceptDraw Solution Park.
www.conceptdraw.com/ solution-park/ marketing-target-and-circular-diagrams
Ring chart
TOWS Matrix

Matrices

"A Guide to the Project Management Body of Knowledge - Fifth Edition provides guidelines for managing individual projects and defines project management related concepts. It also describes the project management life cycle and its related processes, as well as the project life cycle.
The Guide recognizes 47 processes that fall into five basic process groups and ten knowledge areas that are typical of almost all projects.
The five process groups are:
Initiating,
Planning,
Executing,
Monitoring and Controlling,
Closing.
The ten knowledge areas are:
Project Integration Management,
Project Scope Management,
Project Time Management,
Project Cost Management,
Project Quality Management,
Project Human Resource Management,
Project Communications Management,
Project Risk Management,
Project Procurement Management,
Project Stakeholders Management (added in 5th edition).
Each of the ten knowledge areas contains the processes that need to be accomplished within its discipline in order to achieve an effective project management program. Each of these processes also falls into one of the five basic process groups, creating a matrix structure such that every process can be related to one knowledge area and one process group." [A Guide to the Project Management Body of Knowledge. Wikipedia]
The flow chart example "Project management life cycle" was created using the ConceptDraw PRO diagramming and vector drawing software extended with the Flowcharts solution from the area "What is a Diagram" of ConceptDraw Solution Park.
Flowchart - Project management life cycle

CORRECTIVE ACTIONS PLANNING. Involvement Matrix


SWOT Matrix

 Target and Circular Diagrams
This solution extends ConceptDraw PRO software with samples, templates and library of design elements for drawing the Target and Circular Diagrams.
Process Flowchart


 ConceptDraw Solution Park
ConceptDraw Solution Park collects graphic extensions, examples and learning materials
 Biology
Biology solution extends ConceptDraw PRO software with samples, templates and libraries containing biological vector symbols, to help you create scientific and educational designs in the field of biology.
Collaboration in a Project Team

 Circular Arrows Diagrams
Circular Arrows Diagrams solution extends ConceptDraw PRO v10 with extensive drawing tools, predesigned samples, Circular flow diagram template for quick start, and a library of ready circular arrow vector stencils for drawing Circular Arrow Diagrams, Segmented Cycle Diagrams, and Circular Flow Diagrams. The elements in this solution help managers, analysts, business advisers, marketing experts, scientists, lecturers, and other knowledge workers in their daily work.
Marketing Charts

Relative Value Chart Software

Winter Sports Vector Clipart. Medal Map. Spatial Infographics

- Community life cycle matrix - Ring chart | Process Flowchart ...
- Community life cycle matrix - Ring chart | How to Present a Social ...
- Competitor Analysis | Property Management Examples | Community ...
- Community life cycle matrix - Ring chart | Basic Diagramming | Use ...
- Community life cycle matrix - Ring chart | Best Program to Make ...
- Community life cycle matrix - Ring chart | How to Prepare Learning ...
- What is the Accounting Cycle ? | Matrix Organization Structure ...
- Community life cycle matrix - Ring chart
- Involvement matrix - Distribution of responsibilities | Strategic ...
- Life cycle analysis - Ring chart | SWOT matrix - Government contract ...
- Strategic planning - Cycle diagram | Strategic planning cycle - Arrow ...
- Innovation life cycle - Arrow loop diagram | Target and Circular ...
- Leaky bucket diagram | Research cycle - Circle diagram | SWOT ...
- SWOT Matrix | TOWS Matrix | Basic Flowchart Examples | Swot ...
- Matrix Organization Structure | Competitive feature comparison ...
- Involvement matrix - SEPP program roles and responsibilities ...
- Matrix Organization Structure | How to Draw a Matrix Organizational ...
- Product life cycle process - Flowchart | Circular Arrows Diagrams ...
- CORRECTIVE ACTIONS PLANNING. Involvement Matrix | Pdpc ...
- Cycle Charts