SWOT Matrix

TOWS Matrix

CORRECTIVE ACTIONS PLANNING. Involvement Matrix


Competitor Analysis

This SWOT matrix diagram example was created on the base of article "An Easy Way To Jumpstart Your Strategic Plan: SWOT" by Leslie Wolf from the website of the California Digital Library, the University of California. "Strategic planning doesn’t have to be a daunting and lengthy process. The goal is really a simple one: to help you understand your world and build a road map to guide your efforts. ...
This analysis tool can help you focus your attention on the specific success factors that are right for your team.
The tool is called a SWOT analysis. SWOT stands for Strengths and Weaknesses, Opportunities and Threats. Here’s what it means:
(1) Strengths are those positive internal attributes that strengthen your business or team. You can develop plans to capitalize on those strengths.
(2) Weaknesses are those negative internal attributes that are working against your success. You can shore up those weaknesses so they don’t stop your success.
(3) Opportunities are those external conditions that can have a positive effect on your goals. These opportunities can point you in the right direction.
(4) Threats are those external conditions that can have a negative effect on your goals. These threats will affect you less if you can identify and minimize them. ...
We thought it would be helpful to show you a sample SWOT analysis for a business you can easily visualize: a small independent bookstore in a university town. The store owner brought the team together to think about how the bookstore could survive during the continuing financial downturn. After an hour of brainstorming, this is the SWOT analysis they developed." [cdlib.org/ cdlinfo/ 2010/ 09/ 29/ an-easy-way-to-jumpstart-your-strategic-plan-swot/ ]
The matrix diagram example "SWOT analysis for a small independent bookstore" was created using the ConceptDraw PRO diagramming and vector drawing software extended with the SWOT Analysis solution from the Management area of ConceptDraw Solution Park.
SWOT matrix

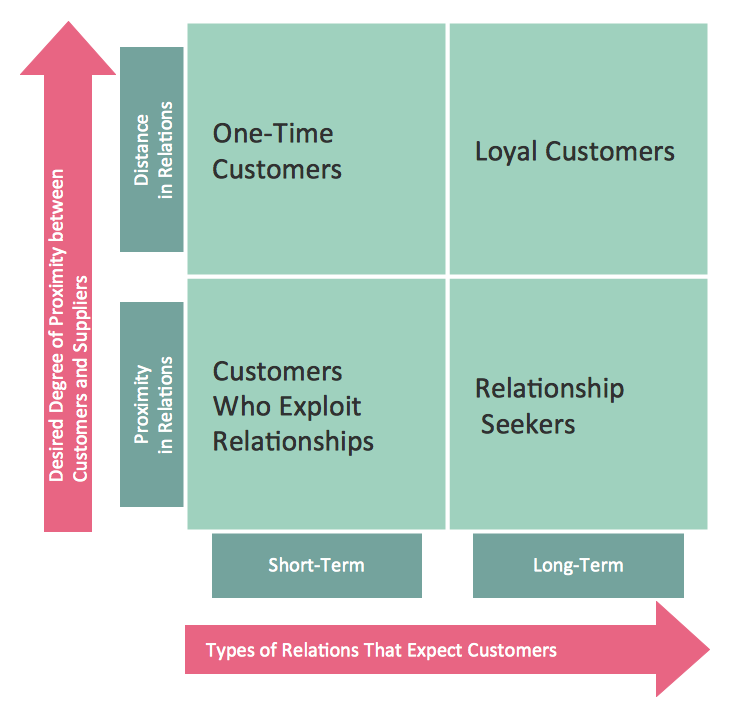
Matrices
Basic Flowchart Examples

Winter Sports Vector Clipart. Medal Map. Spatial Infographics

Relative Value Chart Software

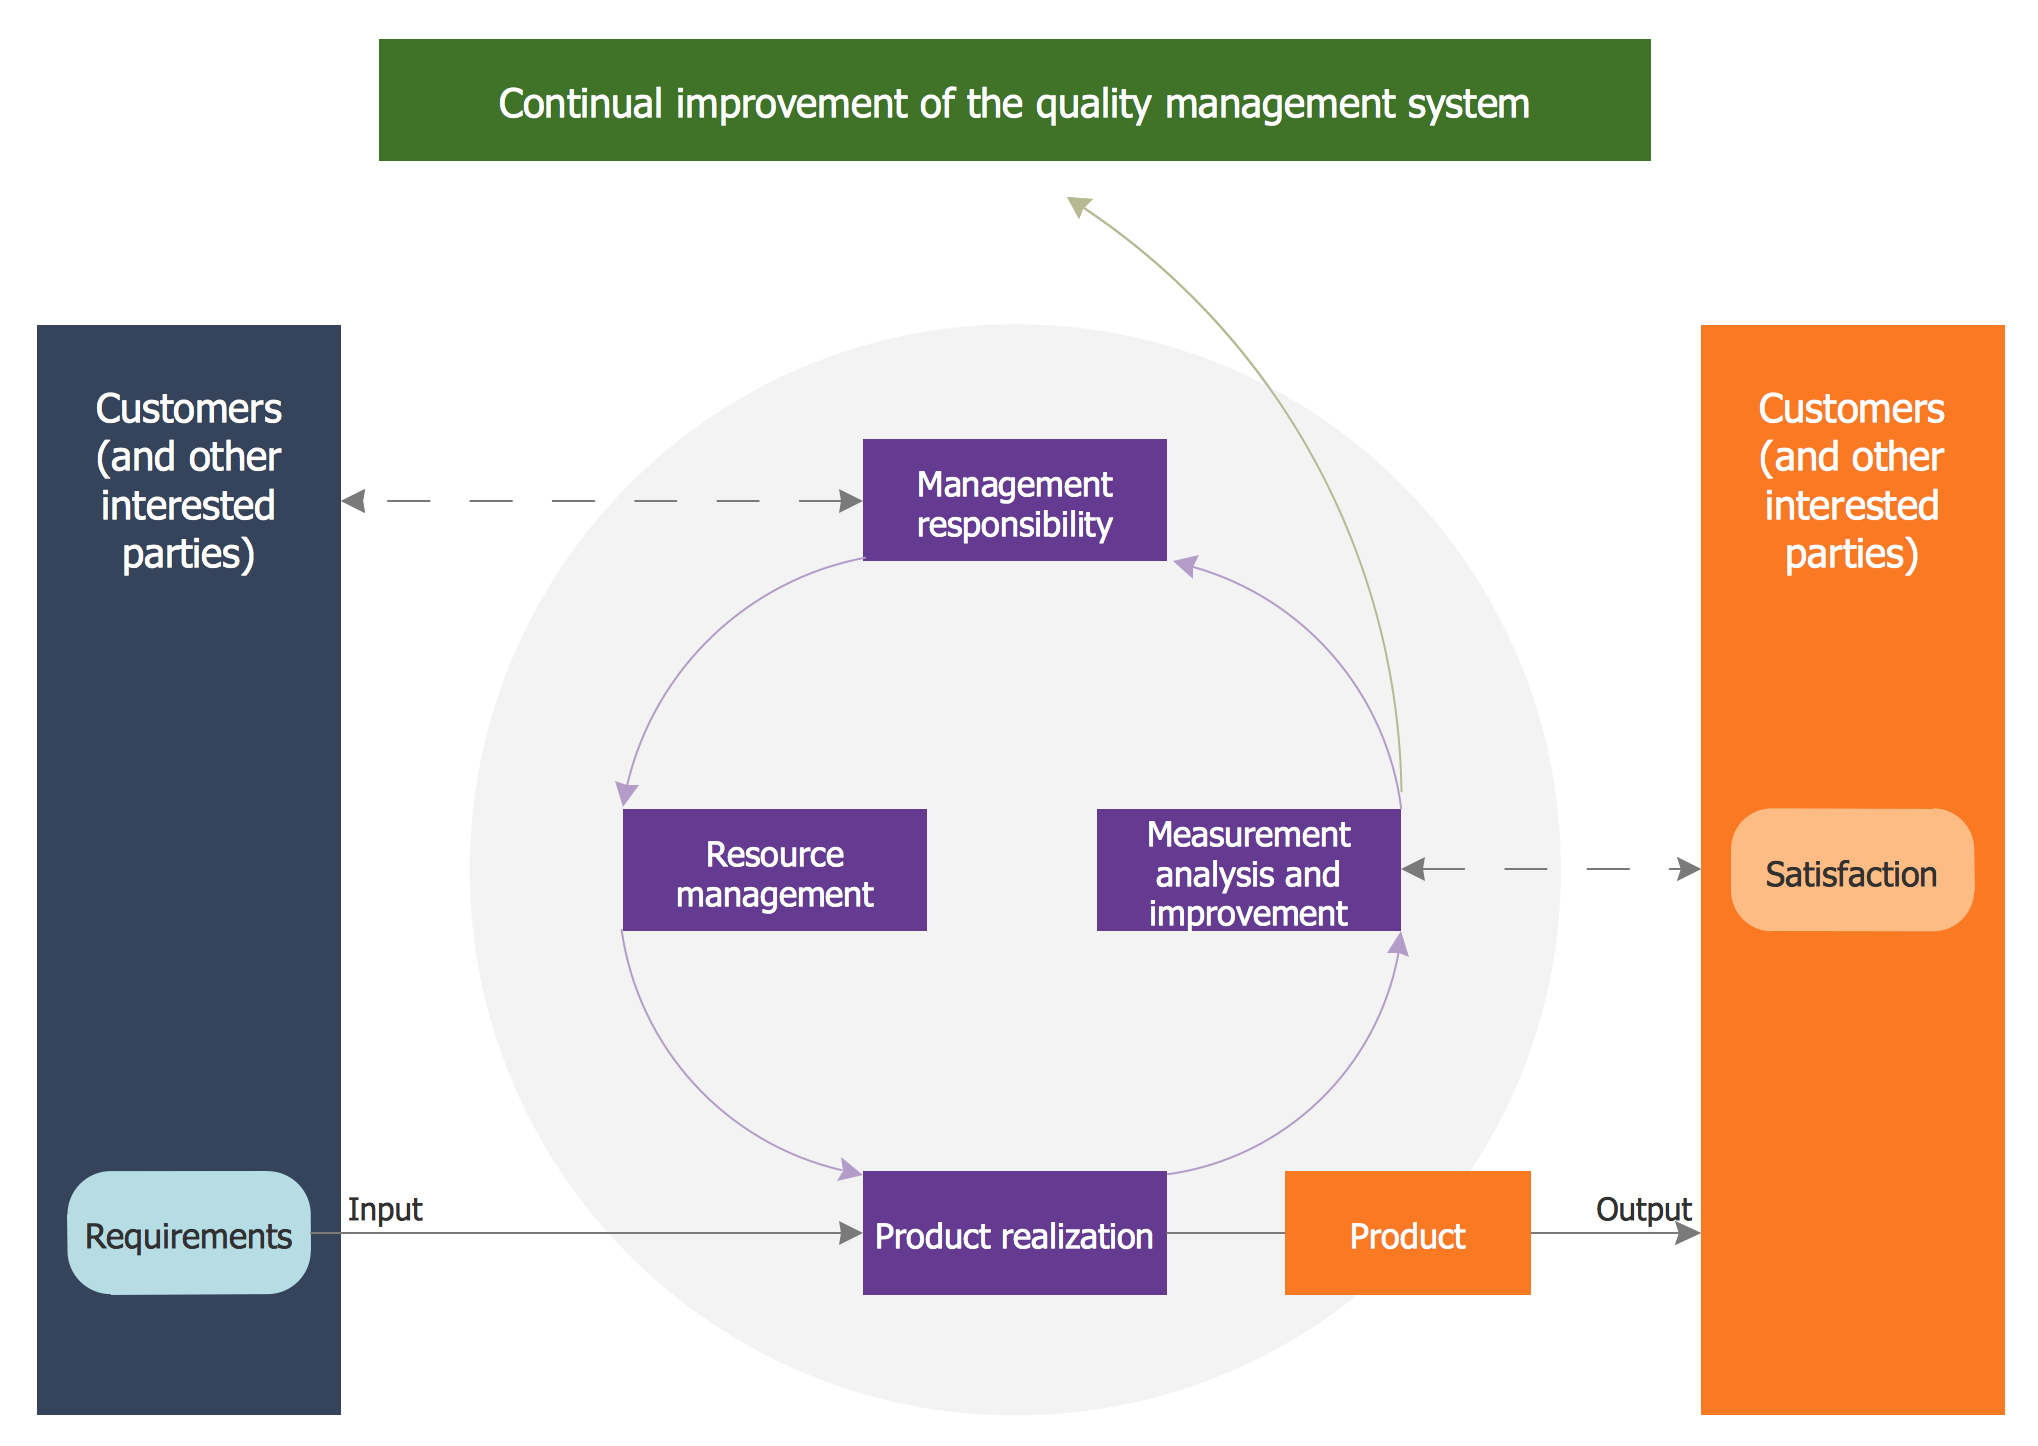
Quality Management System
 ConceptDraw Solution Park
ConceptDraw Solution Park collects graphic extensions, examples and learning materials
 Target and Circular Diagrams
This solution extends ConceptDraw DIAGRAM software with samples, templates and library of design elements for drawing the Target and Circular Diagrams.
Pyramid Chart Examples

Business Process Workflow Diagram


 Basic Circular Arrows Diagrams
This solution extends ConceptDraw DIAGRAM (or later) with samples, templates, and a library of vector stencils for drawing circular arrow diagrams.
- Strategic planning cycle - Arrow loop diagram | SWOT Analysis ...
- Successful Strategic Plan | Strategic planning - Cycle diagram ...
- BPR Diagram. Business Process Reengineering Example | Strategic ...
- Strategic planning - Cycle diagram | Strategic planning cycle - Arrow ...
- Successful Strategic Plan | SWOT analysis for a small independent ...
- Strategic planning - Cycle diagram
- Strategic planning - Cycle diagram
- PROBLEM ANALYSIS . Root Cause Analysis Tree Diagram ...
- Successful Strategic Plan | Strategic planning - Cycle diagram ...
- Successful Strategic Plan | SWOT Analysis Solution - Strategy Tools ...
- Successful Strategic Plan | Strategic planning - Cycle diagram ...
- Successful Strategic Plan | Build Strategies Exchanging Mind Maps ...
- Strategic planning - Cycle diagram | Successful Strategic Plan ...
- Stakeholder Onion Diagrams | Business Swot Analysis For Training ...
- SWOT analysis for a small independent bookstore | Accounting ...
- Successful Strategic Plan | SWOT analysis for a small independent ...
- Successful Strategic Plan | SWOT analysis Software & Template for ...
- Successful Strategic Plan | SWOT Analysis Solution - Strategy Tools ...
- Successful Strategic Plan | Business Board Org Chart | SWOT Matrix ...
- Successful Strategic Plan | Swot Analysis Examples for Mac OSX ...