Pyramid Chart Examples

 Marketing Diagrams
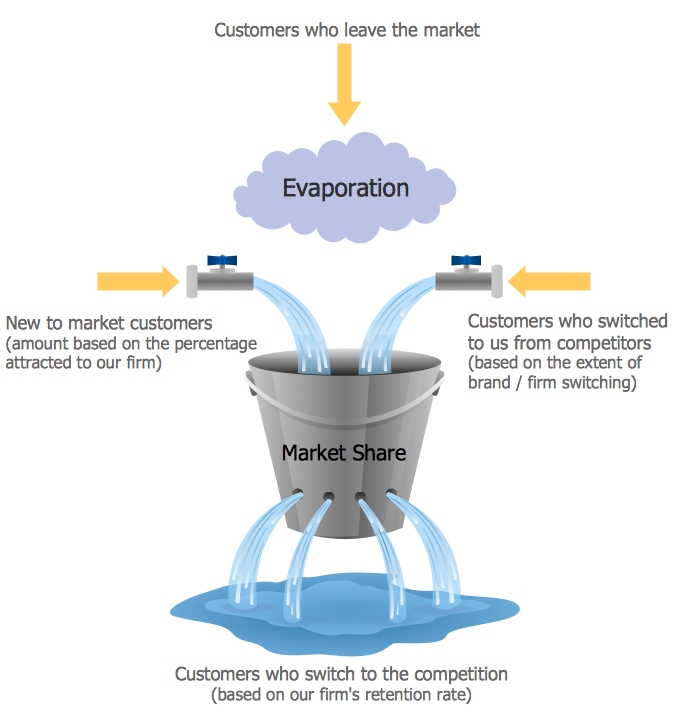
Marketing Diagrams solution extends ConceptDraw DIAGRAM diagramming software with abundance of samples, templates and vector design elements intended for easy graphical visualization and drawing different types of Marketing diagrams and graphs, including Branding Strategies Diagram, Five Forces Model Diagram, Decision Tree Diagram, Puzzle Diagram, Step Diagram, Process Chart, Strategy Map, Funnel Diagram, Value Chain Diagram, Ladder of Customer Loyalty Diagram, Leaky Bucket Diagram, Promotional Mix Diagram, Service-Goods Continuum Diagram, Six Markets Model Diagram, Sources of Customer Satisfaction Diagram, etc. Analyze effectively the marketing activity of your company and apply the optimal marketing methods with ConceptDraw DIAGRAM software.
Competitor Analysis

Best Value — Total Quality Management
 Sales Dashboard
Sales Dashboard solution extends ConceptDraw DIAGRAM software with templates, samples and library of vector stencils for drawing the visual dashboards of sale metrics and key performance indicators (KPI).
 Sales Dashboard
Sales Dashboard solution extends ConceptDraw DIAGRAM software with templates, samples and library of vector stencils for drawing the visual dashboards of sale metrics and key performance indicators (KPI).
 Logistics Flow Charts
Logistics Flow Charts solution extends ConceptDraw DIAGRAM functionality with opportunities of powerful logistics management software. It provides large collection of predesigned vector logistic symbols, pictograms, objects and clipart to help you design with pleasure Logistics flow chart, Logistics process flow diagram, Inventory flow chart, Warehouse flowchart, Warehouse management flow chart, Inventory control flowchart, or any other Logistics diagram. Use this solution for logistics planning, to reflect logistics activities and processes of an enterprise or firm, to depict the company's supply chains, to demonstrate the ways of enhancing the economic stability on the market, to realize logistics reforms and effective products' promotion.
 Block Diagrams
Block diagrams solution extends ConceptDraw DIAGRAM software with templates, samples and libraries of vector stencils for drawing the block diagrams.
Total Quality Management

 Social Media Response
This solution extends ConceptDraw DIAGRAM and ConceptDraw MINDMAP with the ability to draw interactive flow charts with action mind map templates, to help create an effective response to applicable social media mentions.
Examples of Flowcharts, Org Charts and More


How to Create a Pie Chart

Market Chart
Is ConceptDraw DIAGRAM an Alternative to Microsoft Visio?

- Pie Charts | Arrow circle chart - Template | Pie Chart Examples and ...
- Pie Chart Examples and Templates | Atmosphere air composition ...
- Customer Loyalty Chart Image
- Customer Service Chart
- Pie Diagram Examples Economics
- Pie Chart Examples and Templates | Doughnut chart - Template ...
- Doughnut chart - Template | Virtuous circle (management) - Ring ...
- Marketing Diagrams | Design elements - Marketing diagrams ...
- Bar Diagrams for Problem Solving. Create event management bar ...
- Pie Chart Software | Pie Chart Examples and Templates | Pie Donut ...
- Virtuous circle (management) - Ring chart | Arrow circle chart ...
- Examples Of Loyalty Through Chart
- Pie Donut Chart . Pie Chart Examples | Chart Maker for ...
- Different Example Of Loyalty Through A Chart
- Pie Chart Examples and Templates | Donut Chart Templates | Donut ...
- Ring chart
- Virtuous circle (management) - Ring chart | Pie Chart Examples and ...
- Design elements - Marketing diagrams | Marketing Diagrams | What ...
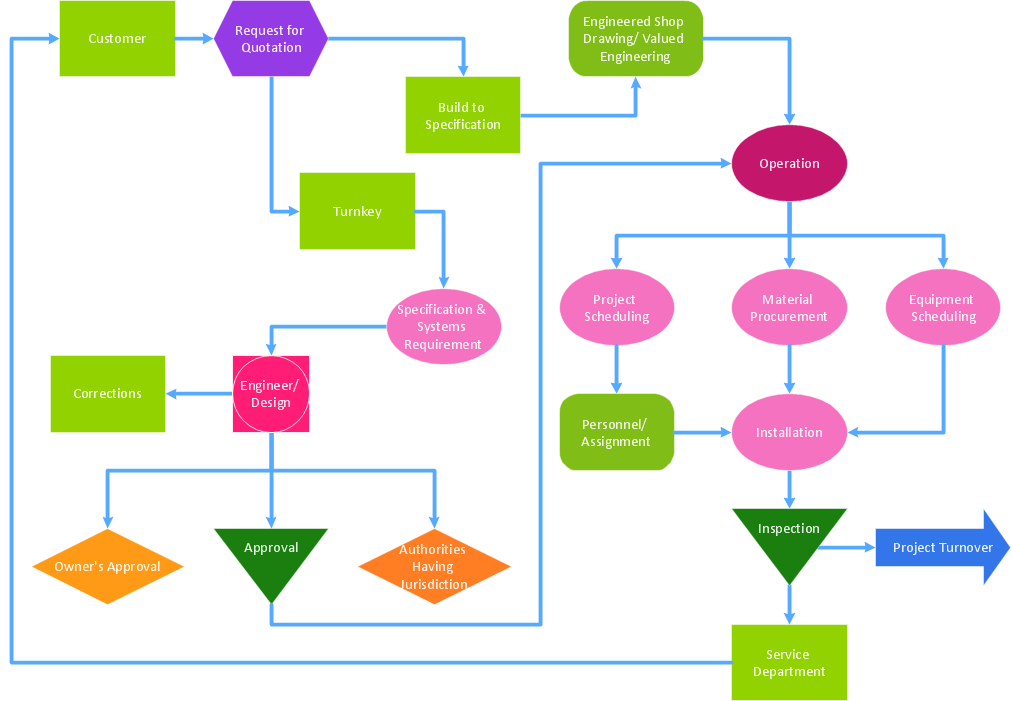
- The Best Implementation Process for Marine Manufacturing
- Revenue Kpi Examples