How To Do A Mind Map In PowerPoint
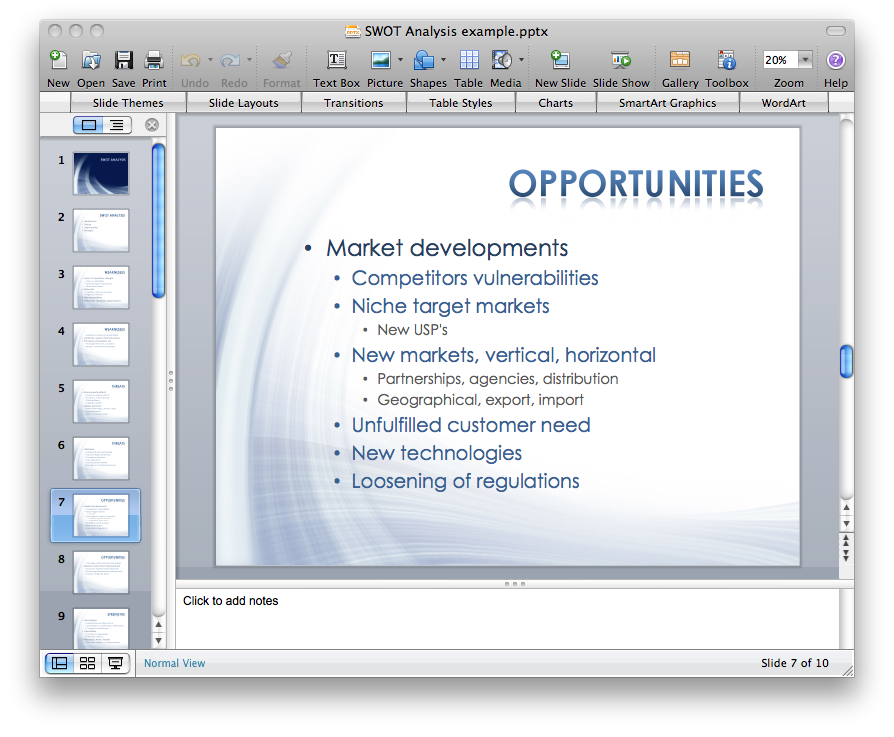
ConceptDraw MINDMAP - an excellent tool for exporting mind maps to PowerPoint to visualize and presenting your project. You can simply generate, change, update your mindmap and then make a presentation in PowerPoint.How to Create a PowerPoint Presentation from a SWOT Analysis Mindmap
You can use SWOT analysis PowerPoint presentation to represent strengths, weakness, opportunities, and threats involved in your SWOT matrix.One formula of professional mind mapping : input data + output data + make great presentation
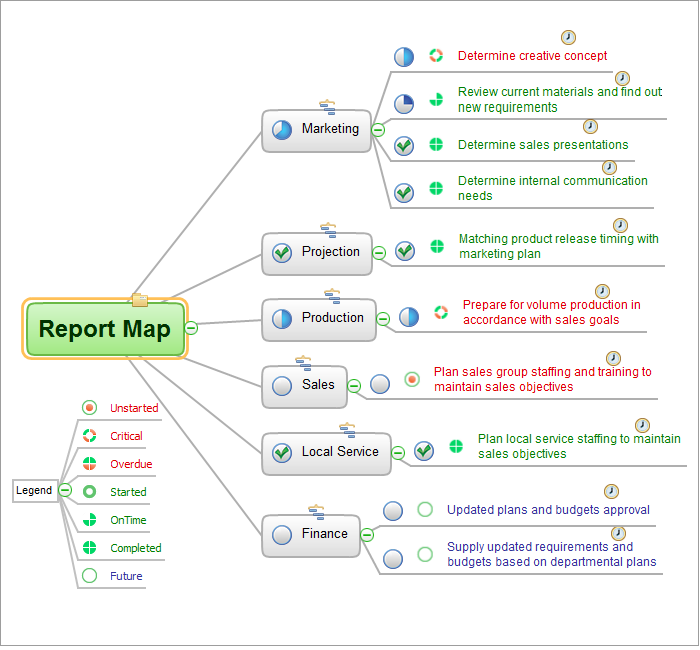
ConceptDraw MINDMAP is a powerful software from ConceptDraw Office suite, which provides a lot of tools and components for professional Mind Mapping. Besides the extensive tools for creation attractive and great-looking Mind Maps, it offers also wide import capabilities from MS Office files and mind mapping files MindJet MindManager, XMind and FreeMind, extensive export capabilities to common formats, such as PDF, HTML, different graphic formats, the possibility to generate MS Office documents, Project Management reports, PowerPoint presentations and demonstrate them via Skype conference call. Use of Skype conference call feature lets you to demonstrate the presentation's slide show and control it on computers of Skype call participants. This Report Mind Map example created in ConceptDraw MINDMAP software depicts the current project status and includes many pages and slides. This Project Status Report can be easy played as a slide show presentation on the large screen or to remote team using Skype conference call.
 SWOT Analysis
SWOT and TOWS Matrix Diagrams solution extends ConceptDraw PRO and ConceptDraw MINDMAP software with features, templates, samples and libraries of vector stencils for drawing SWOT and TOWS analysis matrices and mind maps.
 Metro Map
Metro Map solution extends ConceptDraw PRO software with templates, samples and library of vector stencils for drawing the metro maps, route maps, bus and other transport schemes, or design tube-style infographics.
Flowcharts in PowerPoint
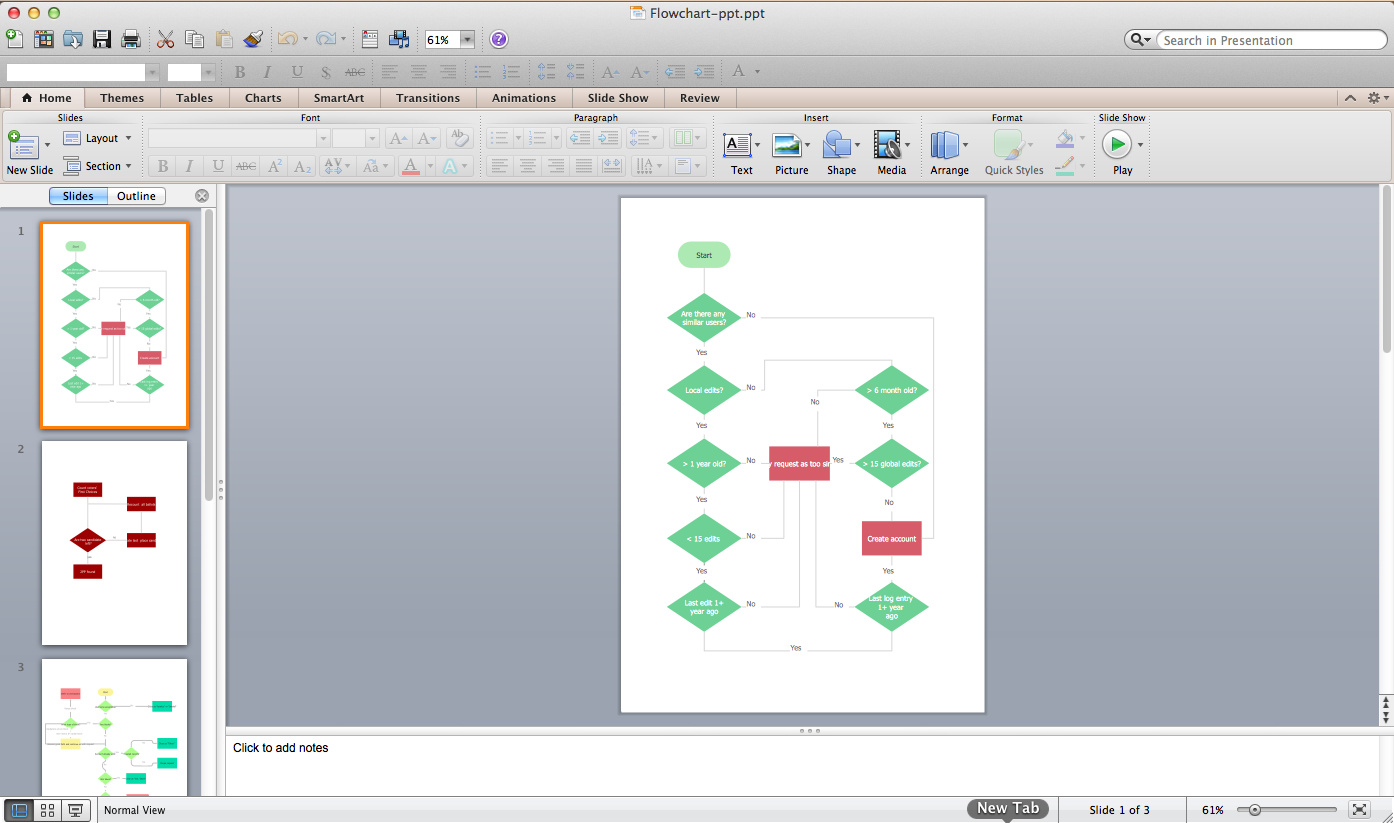
To create flowcharts in MS PowerPoint, programs designed specifically for the purpose of creating flowcharts are particularly well-suited to the task.Purchasing Flow Chart. Purchasing Flowchart Example
This sample shows the Purchasing Flow Chart Diagram that displays the money flow in the carbon offset sphere. The carbon offsets are the compensatory measures that the companies make for the carbon emissions. You can see on this sample the groups that have interests in the carbon offsets and the money flow after the carbon offset vendors sold the carbon offsets.Subway infographic design elements - software tools
Subway infographic design elements of MetroMap and ConceptDraw software tools.
 Business Productivity Area
Business Productivity Solutions extend ConceptDraw products with tools for making presentations, conducting meetings, preparing documents, brainstorming, or building new strategies.
 Rapid UML
Rapid UML solution extends ConceptDraw PRO software with templates, samples and libraries of vector stencils for quick drawing the UML diagrams using Rapid Draw technology.
Workflow to Make a Purchase. Accounting Flowchart Example
Purchasing Workflow Chart as a methods for documenting accounting information systems. Symbols and Methods for designing Accounting System.How to draw Metro Map style infographics? (London)
Tool to draw Metro Map styled inforgraphics. London Tube map sample.Business Process Modeling with ConceptDraw
Business Process Modeling Notation -BPMN- is a set of standard symbols that allow you to create a graphical view of a business process. The symbols were developed to help users develop standard, unified structure of processes, and any messages shared between these processes. This is essense of business process improvement tools.Approval Process and Segregation of Responsibilities Accounting Flowchart Example
How to build segregation of duties using drawing tools from Accounting Flowcharts Solution for ConceptDraw PRO software.- How To Do A Mind Map In PowerPoint | How To ... - Conceptdraw.com
- How to show a mind map presentation via Skype | How To Make the ...
- How To Do A Mind Map In Powerpoint | How To Make an Effective ...
- Organizational Structure | How To Do A Mind Map In PowerPoint ...
- How To Do A Mind Map In PowerPoint | Best Mind Mapping ...
- How to show a mind map presentation via Skype - Conceptdraw.com
- How To Do A Mind Map In Powerpoint | How to Use the Export To ...
- How To Do A Mind Map In PowerPoint | One formula of professional ...
- Word Exchange | One formula of professional mind mapping : input ...
- How To Do A Mind Map In PowerPoint | Presenting a Slide Show to ...
- How to show a mind map presentation via Skype - Conceptdraw.com
- One formula of professional mind mapping : input data + output data ...
- One formula of professional mind mapping : input data + output data ...
- How to do presentation of Mind Maps via Skype conference call ...
- Using mind maps created by Mindjet MindManager for Presenting ...
- One formula of professional mind mapping : input data + output data ...
- Fire Exit Plan | How To Create Emergency Plans | How To Create ...
- How to Exchange ConceptDraw MINDMAP Files with Mindjet ...
- How to Import Mind Maps from XMind | How to make great ...
- How to Import Mind Maps from XMind | How to make great ...


