Flowcharts in PowerPoint
ConceptDraw defines some flowchart types, divided into ten categories.
Every flowchart type has specific shapes and examples.
ConceptDraw DIAGRAM is a powerful software for creating the Flowcharts.
Flowcharts solution from the "Diagrams" area of ConceptDraw Solution Park helps you to design the professional looking Flowchart Diagrams quick and easy using the ConceptDraw DIAGRAM diagramming and vector drawing software.
The documents of ConceptDraw DIAGRAM with Flowcharts are vector graphic documents and can be exported to the MS PowerPoint Presentation format.
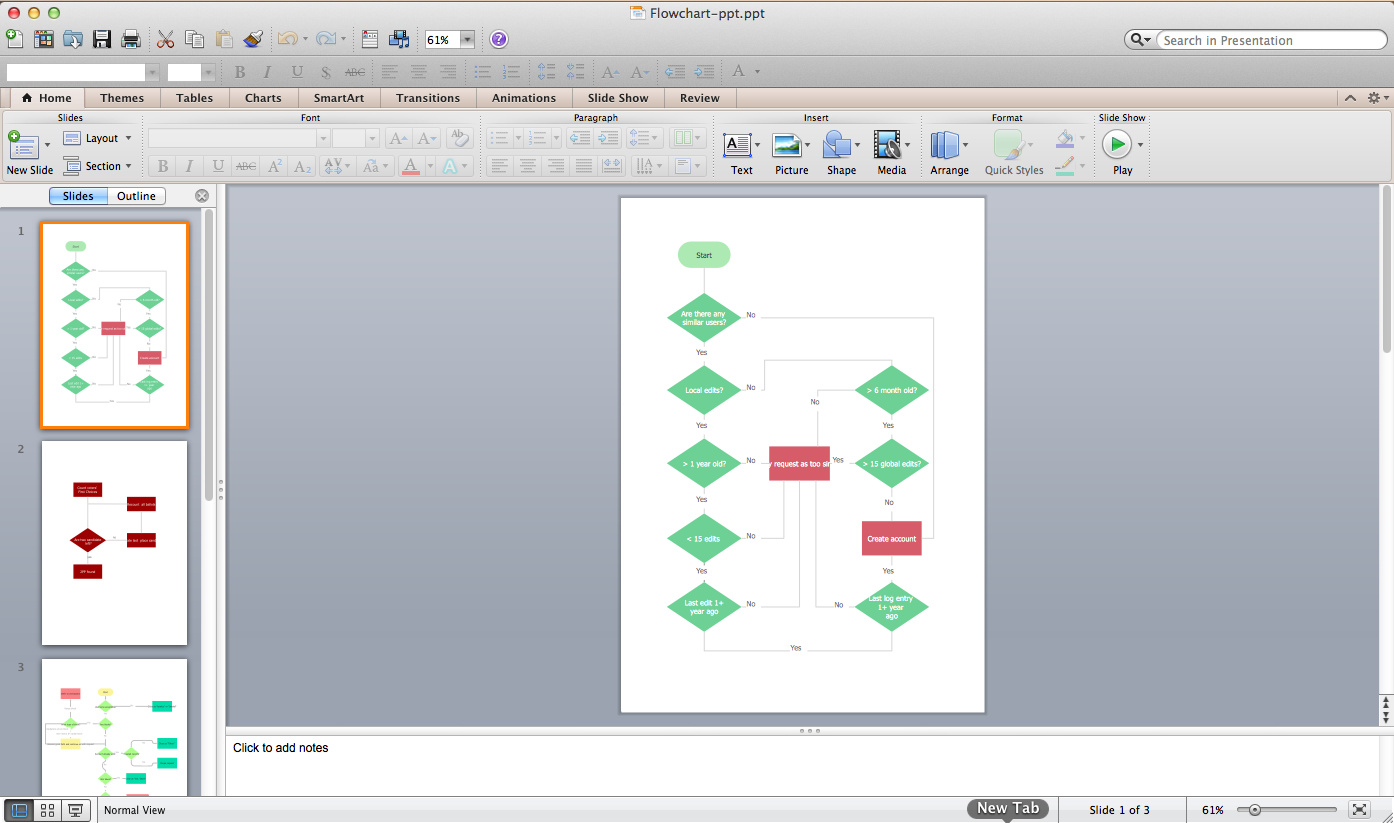
Pic.1. Flowcharts in PowerPoint
This sample shows the Flowcharts created in ConceptDraw DIAGRAM using the Flowcharts solution, quickly and simply exported in MS PowerPoint Presentation format and opened in MS PowerPoint.
ConceptDraw DIAGRAM allows you also import the MS PowerPoint Presentation documents.
See also Samples:
-
Flowcharts
- Orgcharts
- Business Charts — Area, Line and Scatter
- Marketing — Charts & Diagrams
- Quality and Manufacturing Charts
- Business Process Diagrams — Flow Charts
- Marketing — Flowcharts & Process Diagrams
- Business Diagrams — Concept Maps
- Business processes — Flow charts
- Marketing — Flowcharts and Process Diagrams
- Finance and Accounting
- Marketing — Social Media
- Business Diagrams
- Orgcharts
SEVEN RELATED HOW TO's:
Collaboration tool for project management enables you to give a new role to knowledge management and document sharing within your team.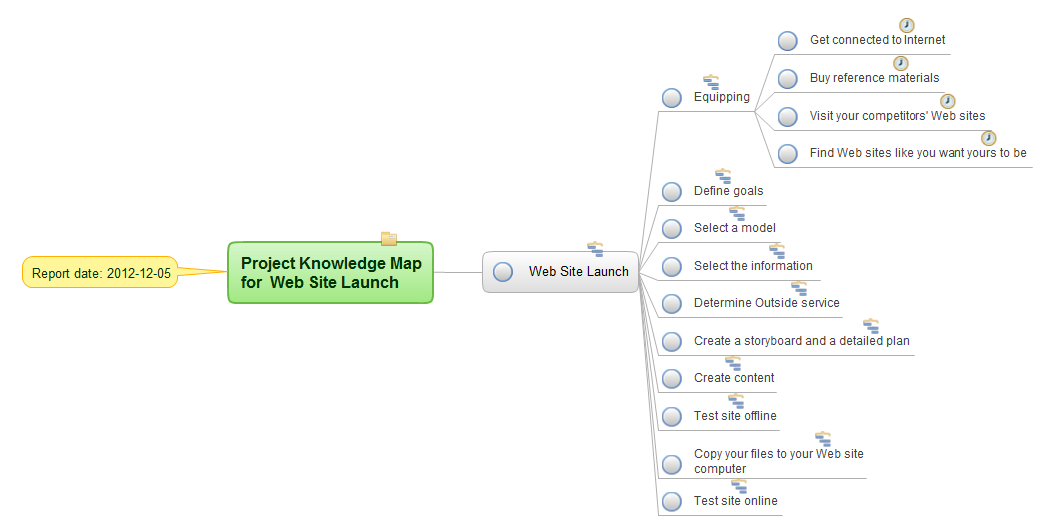
Picture: How To Use Collaboration Tool in Project Management
Related Solution:
Mind map template of a strategy map that can help you display a variety of performance measures that can have an impact on your organization.
Picture: SWOT Analysis
Related Solution:
ConceptDraw DIAGRAM Comparison with Omnigraffle Professional and MS Visio. All source ConceptDraw documents are vector graphic documents. They are available for reviewing, modifying, or converting to a variety of formats: PDF file, MS PowerPoint, MS Visio, and many other graphics formats.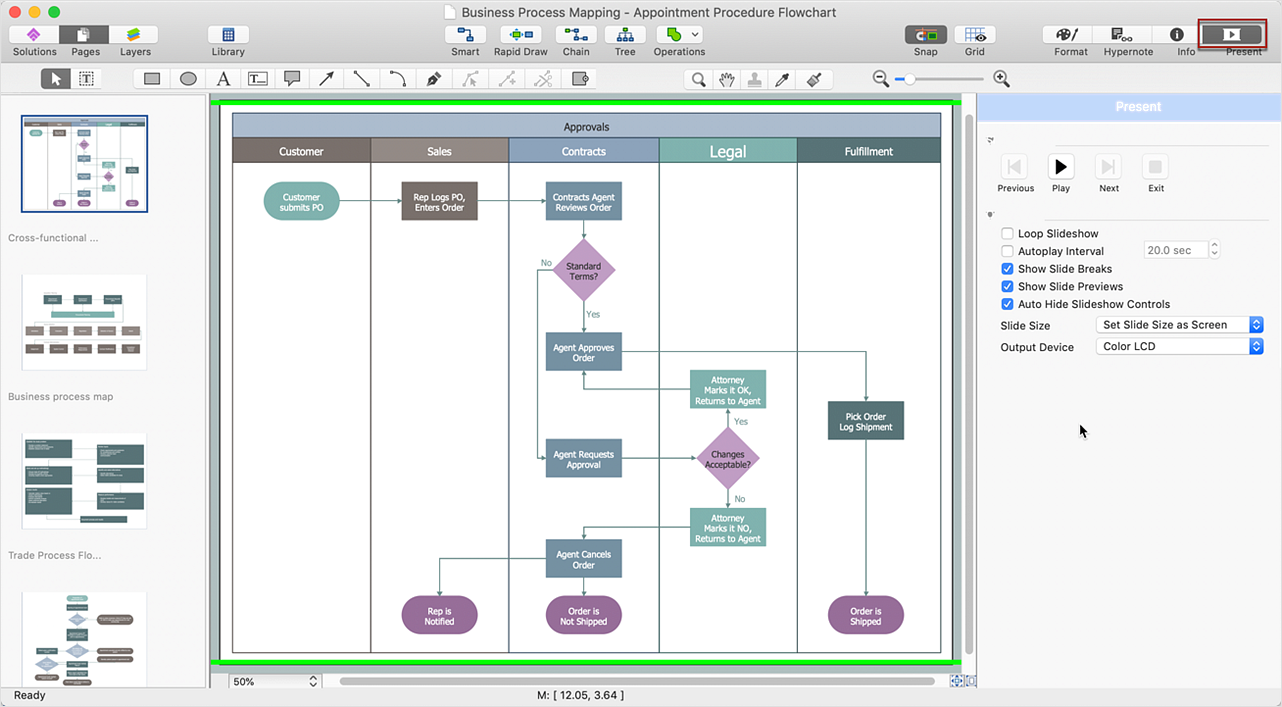
Picture: ConceptDraw DIAGRAM Comparison with Omnigraffle Professional and MS Visio
Related Solution:
Every corporate network is unique, though there are guidelines and best practices in developing networks. As it is quite difficult to implement a pure topology within a company, using a hybrid network topology is considered a better solution. As a rule, such network assembles advantages and features of source topologies.
This diagram is an example of the Hybrid network. This type of network topology means a conjunction of other network topologies. Such as star-bus, ring-mesh topologies, etc. It should be obviously diverse networks. The final computer network inherits both advantages and disadvantages of its ingredients. Using the ConceptDraw Computer and Networks solution including vector graphic libraries and templates one can develop professional custom network diagrams of any topology and complexity.
Picture: Hybrid Network Topology
Related Solution:
Usually for drawing HVAC plans you need make a lot of efforts and spend a considerable amount of time. ConceptDraw DIAGRAM software will help you radically change this. HVAC Marketing Plan design without efforts? It is reality with HVAC Plans Solution from the Building Plans Area of ConceptDraw DIAGRAM Solution Park.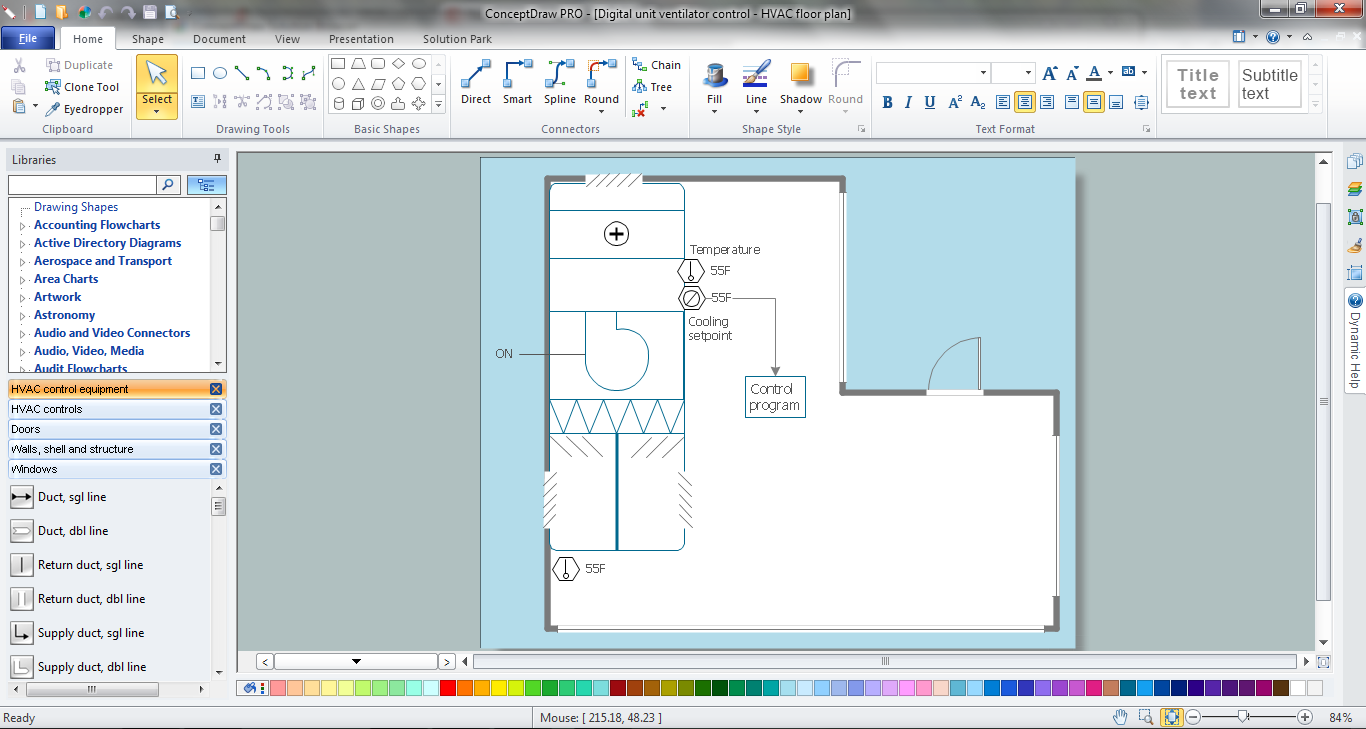
Picture: HVAC Marketing Plan
Related Solution:
Your information is available where and how you need it. All information you send from ConceptDraw MINDMAP is indexed for you by Evernote, making information easy to find and use.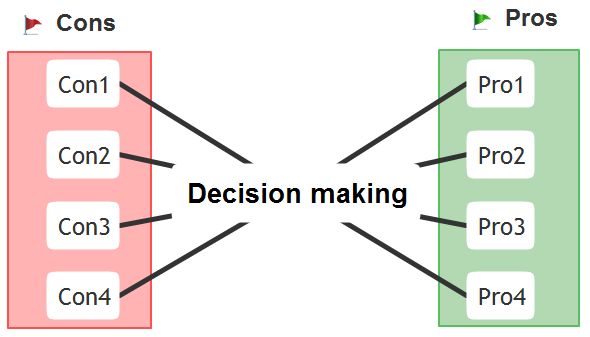
Picture: The Best Productivity Software
Related Solution:
The Value Stream Map is one of the key tools of lean practitioners. It helps aptly describe the manufacturing processes both complex and simple. It supports process improvement, allows identifying waste, and reducing process cycle times. Use ConceptDraw DIAGRAM extended with Value Stream Mapping solution to document processes starting with a professionally designed Value Stream Mapping template.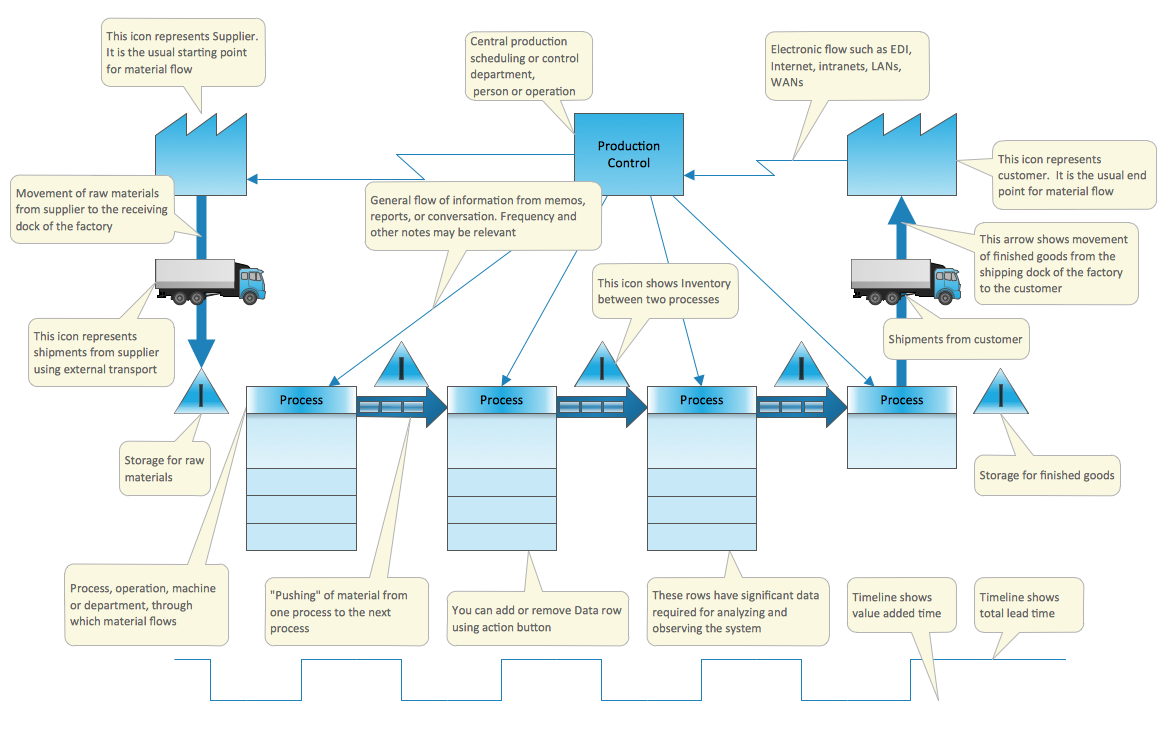
Picture: Value Stream Mapping Template
Related Solution:
ConceptDraw
DIAGRAM 18