Types of Flowcharts


Business Process Elements: Activities
")

Business Process Elements: Swimlanes
")
Database Flowchart Symbols

Business Process Flow Diagram

ERD Symbols and Meanings


UML Block Diagram

Diagramming Software for UML Composite Structure Diagrams


 Fishbone Diagram
Fishbone Diagrams solution extends ConceptDraw PRO software with templates, samples and library of vector stencils for drawing the Ishikawa diagrams for cause and effect analysis.
Gane Sarson Diagram

HelpDesk
How to Add a Block Diagram to a PowerPoint Presentation

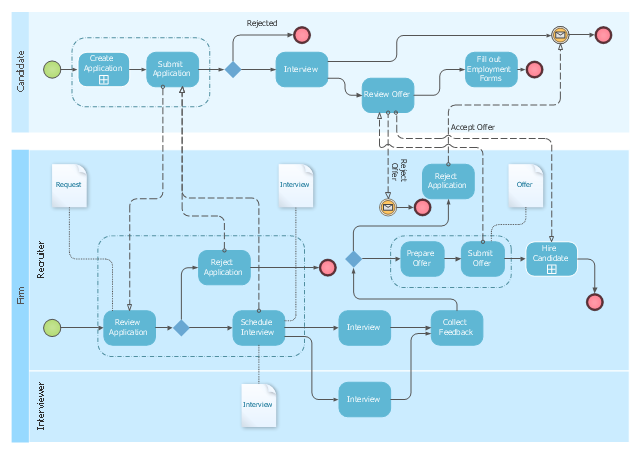
This BPMN diagram sample shows the recruitment (hiring) process workflow.
"Recruitment refers to the process of attracting, screening, selecting, and onboarding a qualified person for a job. At the strategic level it may involve the development of an employer brand which includes an "employee offering".
The stages of the recruitment process include: job analysis and developing some person specification; the sourcing of candidates by networking, advertising, and other search methods; matching candidates to job requirements and screening individuals using testing (skills or personality assessment); assessment of candidates' motivations and their fit with organizational requirements by interviewing and other assessment techniques. The recruitment process also includes the making and finalizing of job offers and the induction and onboarding of new employees.
Depending on the size and culture of the organization, recruitment may be undertaken in-house by managers, human resource generalists and/ or recruitment specialists. Alternatively, parts of the process may be undertaken by either public-sector employment agencies, commercial recruitment agencies, or specialist search consultancies." [Recruitment. Wikipedia]
The BPMN (Business Process Model and Notation) diagram example "Hiring process BPMN 1.2 diagram" was created using the ConceptDraw PRO diagramming and vector drawing software extended with the Business Process Diagram solution from the Business Processes area of ConceptDraw Solution Park.
Employee recruitment workflow
BPR Diagram. Business Process Reengineering Example

 Event-driven Process Chain Diagrams
Event-driven Process Chain (EPC) Diagram is a type of flowchart widely used for modeling in business engineering and reengineering, business process improvement, and analysis. EPC method was developed within the Architecture of Integrated Information Systems (ARIS) framework.
UML Use Case Diagram Example Registration System

- Contoh Business Process Chart
- Business process diagram BPMN 1.2 - Hiring process | Contoh ...
- Fishbone Diagram | Fishbone Diagram Problem Solving | Fishbone ...
- Contoh Diagram Fishbone
- Total Quality Management TQM Diagrams | Event-driven Process ...
- Flowchart Components | Business Process Diagrams | Contoh ...
- Flowchart Components | Contoh Flowchart | Process Flowchart ...
- Process Flowchart | Contoh Flowchart | Bar Diagrams for Problem ...
- Contoh Flowchart | HR Management Software | Business process ...
- Business Process Modeling Notation Template | How Do You Make ...
- Process Flowchart | Contoh Flowchart | Purchasing Flowchart ...
- Contoh Flowchart | How to Draw Pictorial Chart . How to Use ...
- UML Diagram | DFD Library - Design elements | Contoh Flowchart ...
- Process Flowchart | Basic Flowchart Symbols and Meaning | BPR ...
- Contoh Flowchart | Process Flowchart | Business diagrams & Org ...
- Data Flow Diagrams | Interactive Voice Response Diagrams | Data ...
- Fishbone diagram - HAN project | Flowchart Components | Contoh ...
- Diagram Of Business Logistics
- Contoh Data Flow Diagram