"A continual improvement process, also often called a continuous improvement process (abbreviated as CIP or CI), is an ongoing effort to improve products, services, or processes. These efforts can seek "incremental" improvement over time or "breakthrough" improvement all at once. Delivery (customer valued) processes are constantly evaluated and improved in the light of their efficiency, effectiveness and flexibility.
Some see CIPs as a meta-process for most management systems (such as business process management, quality management, project management, and program management)." [Continual improvement process. Wikipedia]
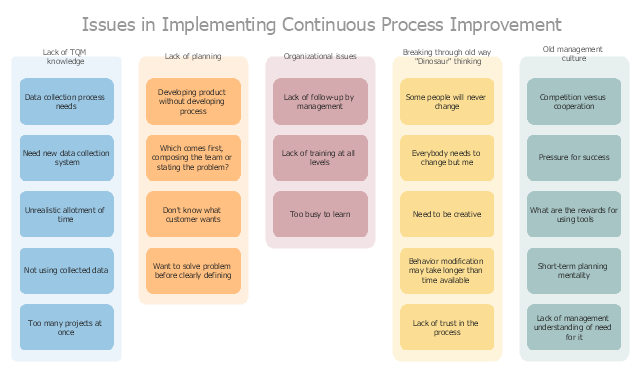
The affinity diagram example "Implementing continuous process improvement" was created using the ConceptDraw PRO diagramming and vector drawing software extended with the solution "Seven Management and Planning Tools" from the Management area of ConceptDraw Solution Park.
Some see CIPs as a meta-process for most management systems (such as business process management, quality management, project management, and program management)." [Continual improvement process. Wikipedia]
The affinity diagram example "Implementing continuous process improvement" was created using the ConceptDraw PRO diagramming and vector drawing software extended with the solution "Seven Management and Planning Tools" from the Management area of ConceptDraw Solution Park.
Affinity diagram
HelpDesk
How to Create a SIPOC Diagram

Business Process Reengineering. Business Process Example

Organizational Structure Total Quality Management

Quality Improvement

Total Quality Management Value

TQM Diagram Example

A Study of the Business Value of Total Quality Management

PROBLEM ANALYSIS. Identify and Structure Factors


Quality Management System

Mind Mapping in the Quality Management

TQM Software — Build Professional TQM Diagrams

Identifying Quality Management System

Definition TQM Diagram

Value Stream Mapping for the Lean Office
")
- Affinity diagram - Implementing continuous process improvement
- Affinity Diagram | Affinity diagram - Implementing continuous ...
- Seven Management and Planning Tools | Affinity diagram ...
- EPC for Business Process Improvement | Process Improvement ...
- Continuous Improvement Plan Sample
- Process Flowchart | Quality Improvement | TQM Software — Build ...
- Business Process Management | Process Flowchart | Types of ...
- Business Process Reengineering Examples | Business Process ...
- Business Process Management | Process Flowchart | BPR Diagram ...
- Project management life cycle - Flowchart | Business Process ...
- Affinity Diagram Software | Total Quality Management | Affinity ...
- Affinity Diagram | Affinity Diagram Software | Affinity Diagram ...
- Business Process Improvement Wiki
- Affinity Diagram With Examples
- The Best Tool for Business Process Modeling | PROBLEM ...
- Improvement Strategy Template
- Business Process Reengineering Examples | BPR Diagram ...
- Affinity Diagram Software | Affinity Diagram | Affinity Diagram ...
- BPR Diagram. Business Process Reengineering Example ...