Example of Flowchart Diagram

Basic Diagramming


Construction Project Chart Examples

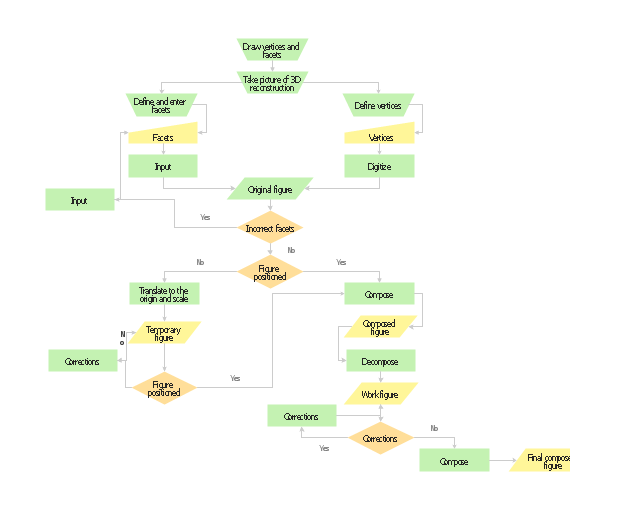
Planning scheme for the construction of a synthetic object.
"Computer-generated imagery (CGI) ... is the application of computer graphics to create or contribute to images in art, printed media, video games, films, television programs, commercials, and simulators. The visual scenes may be dynamic or static, and may be two-dimensional (2D), though the term "CGI" is most commonly used to refer to 3D computer graphics used for creating scenes or special effects in films and television." [Computer-generated imagery. Wikipedia]
The flow chart example "Synthetic object construction" was created using the ConceptDraw PRO diagramming and vector drawing software extended with the Flowcharts solution from the area "What is a Diagram" of ConceptDraw Solution Park.
Flowchart - Synthetic object construction
Contoh Flowchart

2 Circle Venn Diagram. Venn Diagram Example

3 Circle Venn. Venn Diagram Example

3 Circle Venn Diagram. Venn Diagram Example

Material Requisition Flowchart. Flowchart Examples

Flow Chart Creator

How to Create a Process Flowchart

Flow Chart

Flow Diagrams

Best Tool for Infographic Construction

Accounts Payable Process Flow Chart

Types of Flowcharts


Accounting Flowchart: Purchasing, Receiving, Payable and Payment

Process Flow Chart Symbols

 Flowcharts
The Flowcharts solution for ConceptDraw DIAGRAM is a comprehensive set of examples and samples in several varied color themes for professionals that need to represent graphically a process. Solution value is added by the basic flow chart template and shapes' libraries of flowchart notation. ConceptDraw DIAGRAM flow chart creator lets one depict the processes of any complexity and length, as well as design the Flowchart either vertically or horizontally.
 Cross-Functional Flowcharts
Cross-functional flowcharts are powerful and useful tool for visualizing and analyzing complex business processes which requires involvement of multiple people, teams or even departments. They let clearly represent a sequence of the process steps, the order of operations, relationships between processes and responsible functional units (such as departments or positions).
- Land sales process flowchart | Best Tool for Infographic Construction ...
- Construction Project Chart Examples | Process Flowchart | How to ...
- Construction Flowchart Examples
- Construction Project Chart Examples | Process Flowchart | Office ...
- Synthetic object construction - Flowchart | Construction Flowchart
- Process Flowchart | Flow Chart Diagram Examples | Flow Diagrams ...
- Synthetic object construction - Flowchart | Algorithm Flow Chart ...
- Construction Project Management Process Flow Chart
- Flowcharts | Construction Project Management Flow Chart
- Process Flowchart | Flow chart Example . Warehouse Flowchart ...
- Construction Project Communication Flow Chart
- Construction Project Chart Examples | Restaurant Floor Plans ...
- Synthetic object construction - Flowchart | Spatial infographics ...
- Construction Project Chart Examples | How to Create Presentation ...
- Synthetic object construction - Flowchart | Euclidean algorithm ...
- Process Flowchart | Flow Chart Diagram Examples | Flow chart ...
- Synthetic object construction - Flowchart | Flowcharts | Investment ...
- Construction Project Flow Chart Template
- Process Flowchart | Basic Diagramming | Gant Chart in Project ...