HelpDesk
How to Draw a Gantt Chart Using ConceptDraw PRO

HelpDesk
What Information to be Displayed in the ConceptDraw PROJECT Gantt Chart View


HelpDesk
What Information can be Displayed in the Multiproject Dashboard View

HelpDesk
How to Change Project Task Completion on the Gantt

HelpDesk
How to Set a Project Baseline Using ConceptDraw PROJECT

Collaboration in a Project Team

How to Create Gantt Chart

Scrum

Gantt Chart Software

HelpDesk
How to View Tasks of Multiple Projects Using Scheduler

HelpDesk
How to Create a Timeline Diagram in ConceptDraw PRO

The vector stencils library "Project management" contains 30 project management icons.
Use it to design your business and finance illustrations and infographics with ConceptDraw PRO diagramming and vector drawing software.
The vector stencils library "Project management" is included in the Business and Finance solution from the Illustration area of ConceptDraw Solution Park.
Use it to design your business and finance illustrations and infographics with ConceptDraw PRO diagramming and vector drawing software.
The vector stencils library "Project management" is included in the Business and Finance solution from the Illustration area of ConceptDraw Solution Park.
Start project

Project plan

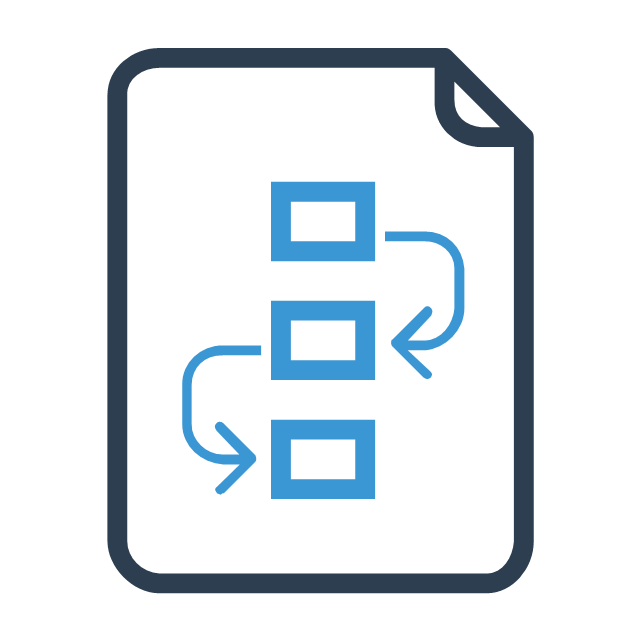
Project scheme
To do list

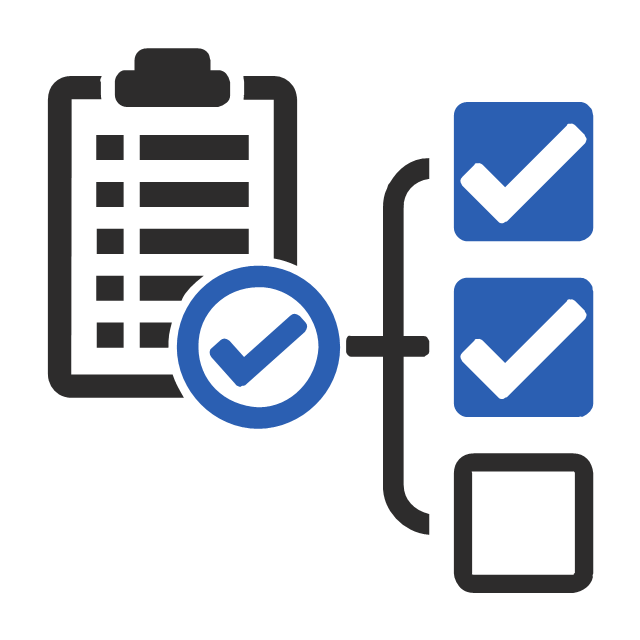
Checklist
Project strategy

Timetable

Project time

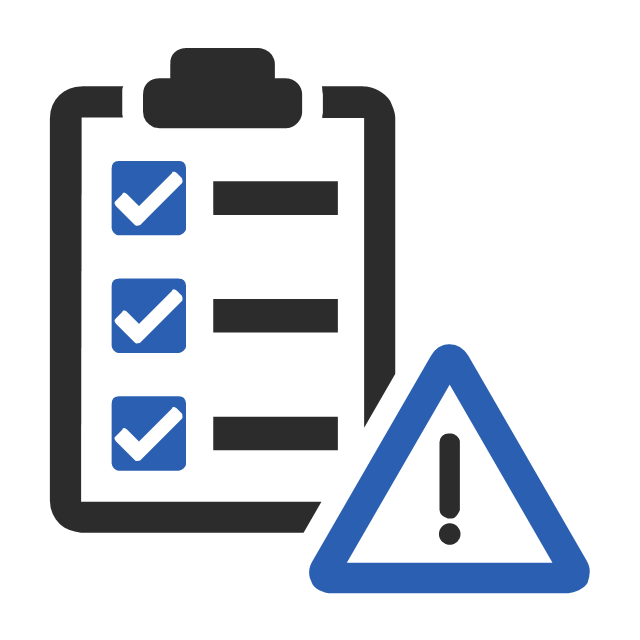
Project fulfillment

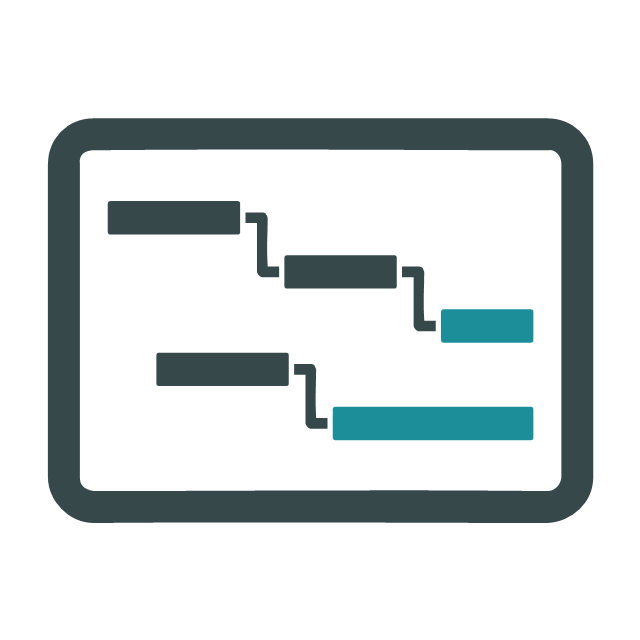
Project Gantt chart
Project completed
Project report

Project management

Project descriptions

Communications

Project team

Project director

Project manager

Assignment of works

Project analyst

Project benefits

Failure to draw on the funds

Cost overrun

Cost

Project expenses

Portfolio

Ticket

Project task

Financial resources

Material resources

Gant Chart in Project Management


HelpDesk
How to Use the Effort-Driven Scheduling Method

- Project Completion Indicator
- Export from ConceptDraw MINDMAP to MS Project ® XML ...
- Project task status dashboard | What Information to be Displayed in ...
- How to Create Multple Projects Schedule on Windows | How to View ...
- Project Completed Png
- Gant Chart in Project Management | Gantt chart examples | How to ...
- Gant Chart in Project Management | How to Draw a Gantt Chart ...
- Project — Assigning Resources | How To Plan and Implement ...
- Project Report Charts
- Pert Diagram Example Project Management
- How to Manage Multiple Projects on Windows | How to View Tasks ...
- Project management - Vector stencils library | Design elements ...
- Status Dashboard | Project management task status dashboard ...
- Gant Chart in Project Management | Project — Working With Costs ...
- Design elements - Project management | Project management ...
- How to Create a Gantt Chart for Your Project | How to Create Gantt ...
- How to Create Presentation of Your Project Gantt Chart | How to ...
- Collaboration in a Project Team | Project task status dashboard ...
- How to Create Gantt Chart | Gantt charts for planning and ...
- Project Management Charts And Graphs