"In project management, a task is an activity that needs to be accomplished within a defined period of time or by a deadline. A task can be broken down into assignments which should also have a defined start and end date or a deadline for completion. One or more assignments on a task puts the task under execution. Completion of all assignments on a specific task normally renders the task completed. Tasks can be linked together to create dependencies." [Task (project management). Wikipedia]
The example "Project task status dashboard" was created using the ConceptDraw PRO diagramming and vector drawing software extended with the Status Dashboard solution from the area "What is a Dashboard" of ConceptDraw Solution Park.
The example "Project task status dashboard" was created using the ConceptDraw PRO diagramming and vector drawing software extended with the Status Dashboard solution from the area "What is a Dashboard" of ConceptDraw Solution Park.
Status dashboard
HelpDesk
What Information to be Displayed in the ConceptDraw PROJECT Gantt Chart View


HelpDesk
How to Draw a Gantt Chart Using ConceptDraw PRO

Collaboration in a Project Team

One formula of professional mind mapping : input data + output data + make great presentation

How To Hold Project Collaboration via Skype


Gantt Chart Software

 PM Planning
The PM Planning solution extends the functional abilities of ConceptDraw MINDMAP and ConceptDraw PROJECT software, allowing to automatically create the spreadsheets reflecting the tasks and project statuses for people who have different project roles. The reporting capabilities of this solution are represented by the possibility to generate a wide range of project reports that allow the project managers, senior management and other project participants to be informed on a project daily progress and monthly objectives: All Inclusive Report, All Visible Columns, Milestones with Notes and Objectives, Projects Goals, Projects Managers, Project Team, and Top Level Tasks. The PM Planning solution from ConceptDraw Solution Park is a strong project management and productivity tool which simplifies the process of reporting and lets one create a document with the desired report, includes the predesigned examples, extends and improves the planning capabilities for all team members, improves the project communication, helps to accurately plan, maintain, and finish projects on time, to track the work of project resources, to perform the analytical work and to make effective decisions.
How to Use Skype for Sharing Documents

Remote Learning Sessions - Webinars

HelpDesk
How to Set a Project Baseline Using ConceptDraw PROJECT

"As a discipline, task management embraces several key activities. Various conceptual breakdowns exist, and these, at a high-level, always include creative, functional, project, performance and service activities.
Creative activities pertain to task creation. In context, these should allow for task planning, brainstorming, creation, elaboration, clarification, organization, reduction, targeting and preliminary prioritization.
Functional activities pertain to personnel, sales, quality or other management areas, for the ultimate purpose of ensuring production of final goods and services for delivery to customers. In context these should allow for planning, reporting, tracking, prioritizing, configuring, delegating, and managing of tasks.
Project activities pertain to planning and time and costs reporting. These can encompass multiple functional activities but are always greater and more purposeful than the sum of its parts. In context project activities should allow for project task breakdown, task allocation, inventory across projects, and concurrent access to task databases.
Service activities pertain to client and internal company services provision, including customer relationship management and knowledge management. In context these should allow for file attachment and links to tasks, document management, access rights management, inventory of client & employee records, orders & calls management, and annotating tasks.
Performance activities pertain to tracking performance and fulfillment of assigned tasks. In context these should allow for tracking by time, cost control, stakeholders and priority; charts, exportable reports, status updates, deadline adjustments, and activity logging.
Report activities pertain to the presentation of information regarding the other five activities listed, including graphical display." [Task management. Wikipedia]
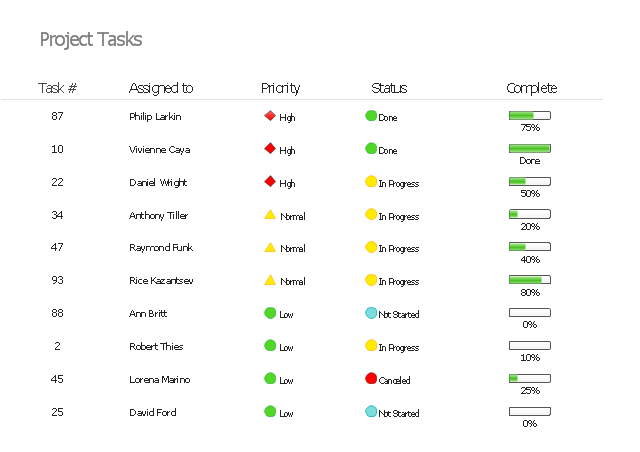
The example "Project tasks dashboard" was created using the ConceptDraw PRO diagramming and vector drawing software extended with the Status Dashboard solution from the area "What is a Dashboard" of ConceptDraw Solution Park.
Creative activities pertain to task creation. In context, these should allow for task planning, brainstorming, creation, elaboration, clarification, organization, reduction, targeting and preliminary prioritization.
Functional activities pertain to personnel, sales, quality or other management areas, for the ultimate purpose of ensuring production of final goods and services for delivery to customers. In context these should allow for planning, reporting, tracking, prioritizing, configuring, delegating, and managing of tasks.
Project activities pertain to planning and time and costs reporting. These can encompass multiple functional activities but are always greater and more purposeful than the sum of its parts. In context project activities should allow for project task breakdown, task allocation, inventory across projects, and concurrent access to task databases.
Service activities pertain to client and internal company services provision, including customer relationship management and knowledge management. In context these should allow for file attachment and links to tasks, document management, access rights management, inventory of client & employee records, orders & calls management, and annotating tasks.
Performance activities pertain to tracking performance and fulfillment of assigned tasks. In context these should allow for tracking by time, cost control, stakeholders and priority; charts, exportable reports, status updates, deadline adjustments, and activity logging.
Report activities pertain to the presentation of information regarding the other five activities listed, including graphical display." [Task management. Wikipedia]
The example "Project tasks dashboard" was created using the ConceptDraw PRO diagramming and vector drawing software extended with the Status Dashboard solution from the area "What is a Dashboard" of ConceptDraw Solution Park.
Project tasks dashboard

Process Flowchart


How to Create Gantt Chart

- Project Progress Status Dashboard
- Status Dashboard | Project task status dashboard | Seven ...
- How To Show Project Progress Peport on Web | Project task status ...
- Project task status dashboard | Project management task status ...
- Priority Status In Progress
- Status Dashboard | Dashboard | Project task status dashboard ...
- Project management task status dashboard | Project task status ...
- Status Dashboard | Project management task status dashboard ...
- How To Show Project Progress Peport on Web | Status indicators ...
- Status Dashboard | How to Report on Multiple Projects Status ...
- Status Dashboard | Project task status dashboard - Template ...
- Project Status Icon In Progress
- Project task status dashboard - Template | Project tasks dashboard ...
- Status Dashboard | PM Dashboards | Project task status dashboard ...
- Project tasks dashboard | Project task status dashboard - Template ...
- Project task status dashboard - Template | Project management task ...
- Status On Progress
- Project management task status dashboard | Project task status ...
- How to Report on Multiple Projects Status | Project management ...
- Status Dashboard | How To Hold Project Collaboration via Skype ...