This site uses cookies. By continuing to browse the ConceptDraw site you are agreeing to our Use of Site Cookies.

How To Show Project Progress Peport on Web

Project progress on web: delivering project status to remote teams and stakeholders via Skype.

One formula of professional mind mapping : input data + output data + make great presentation

Professional Mind Mapping. ConceptDraw MINDMAP professional software to create documents. Mac and PC compatible. MS Office Exchange Solutions. Skype Collaboration. Presentation Tools.

Collaboration in a Project Team

Create with our data flow diagram software perfect data flow diagrams. Download data flow diagram software for FREE. Use hundreds of data flow diagram examples.
HelpDesk

How to Draw a Gantt Chart Using ConceptDraw PRO

A Gantt chart is intended to provide a visualization of a project schedule. It is developed to help planning, coordinating, and tracking on project tasks implementation. One of the most critical resources for a project implementation is a time resources. Gantt chart - is one of the most convenient and popular way of graphical representation of a project tasks progress in conjunction with the corresponding time consumption. Gantt chart's function is to show project tasks completion in a progress, and to make a project manager sure that project tasks were completed on time. ConceptDraw Office is a clear and easy-to-use tool for project management. It is a very handy visual tool that helps make a project processing clear.
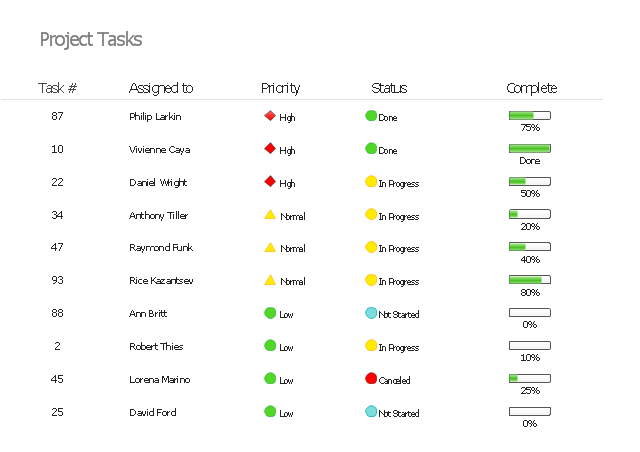
"In project management, a task is an activity that needs to be accomplished within a defined period of time or by a deadline. A task can be broken down into assignments which should also have a defined start and end date or a deadline for completion. One or more assignments on a task puts the task under execution. Completion of all assignments on a specific task normally renders the task completed. Tasks can be linked together to create dependencies." [Task (project management). Wikipedia]
The example "Project task status dashboard" was created using the ConceptDraw PRO diagramming and vector drawing software extended with the Status Dashboard solution from the area "What is a Dashboard" of ConceptDraw Solution Park.
Status dashboard
Status dashboard, shapes alert indicator, progress indicator, progress bar, 5-state alert,
HelpDesk

How to Track Your Project Plan vs. the Actual Project Condition

Conceptdraw PROJECT allows to follow how the project is going. You can easily compare the actual project data with the planned ones. The best tool for effective tracking of the project execution is to compoare real data with project baseline. It consists from the baseline start, baseline finish and baseline cost. Along with Baseline tracking ConceptDraw PROJECT offers several types of visual reports that can help to assess visually the difference between planned and actual project data.

How To Use Collaboration Tool in Project Management

Collaboration tool for project management enables you to give a new role to knowledge management and document sharing within your team.

Remote Learning Sessions - Webinars

A perfect visual tool for presenting to a remote group via Skype. Participants receives document automatically. Participants are able to edit presentation after session. Helpful for webinars, online meetings, remote learning.

Gantt Chart Software

The Gantt Chart is the main interface in ConceptDraw PROJECT. It summarizes the tasks in your project and presents them graphically so you can easily view your progress.
HelpDesk

How to Identify Project Milestones

Tips on how to set milestones in a project file
HelpDesk

How to Create a Timeline Diagram in ConceptDraw PRO

A Timeline is a chart which displays a project plan schedule in chronological order. A Timeline is used in project management to depict project milestones and visualize project phases, and show project progress. The graphic form of a timeline makes it easy to understand critical project milestones, such as the progress of a project schedule. Timelines are particularly useful for project scheduling or project management when accompanied with a Gantt chart. It captures the main of what the project will accomplish and how it will be done. making a project timeline is one of the most important skills a project manager needs have. Making comprehensive, accurate timelines allows you getting every project off in the best way. ConceptDraw PRO allows you to draw a timeline charts using special library.

ConceptDraw PROJECT is an effective tool for new and experienced users with a fine balance of usability and powerful functionality.

Process Flowchart

ConceptDraw is Professional business process mapping software for making process flow diagram, workflow diagram, general flowcharts and technical illustrations for business documents. It is includes rich examples, templates, process flowchart symbols. ConceptDraw flowchart maker allows you to easier create a process flowchart. Use a variety of drawing tools, smart connectors, flowchart symbols and shape libraries to create flowcharts of complex processes, process flow diagrams, procedures and information exchange.
How To Create a Process Flow Chart (business process modelling techniques)

Construction Project Chart Examples

ConceptDraw PROJECT provides a set of construction Gantt chart examples. Project manager requires task tracking, and project examples best approach to start. Make your project applying one of our ready-made examples.

Product Overview

ConceptDraw PROJECT is a vigorous tool for managing single or multiple projects. It lets you determine all essential elements involved into project, control schedules, resources and finances, and monitor projects' progress in most effective yet simple manner.