Export from ConceptDraw PRO Document to a Graphic File


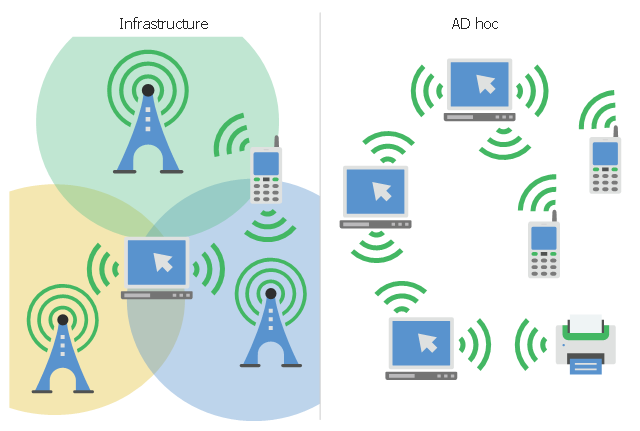
This infographic sample visualizes the Conventional and wireless ad hoc network. It was designed on the base of the Wikimedia Commons file: Běžná bezdrátová síť a ad hoc síť.png.
[commons.wikimedia.org/ wiki/ File:B%C4%9B%C5%BEn%C3%A1_ bezdr%C3%A1tov%C3%A1_ s%C3%AD%C5%A5_ a_ ad_ hoc_ s%C3%AD%C5%A5.png]
This file is licensed under the Creative Commons Attribution-Share Alike 4.0 International license. [creativecommons.org/ licenses/ by-sa/ 4.0/ deed.en]
"A wireless ad hoc network (WANET) is a decentralized type of wireless network. The network is ad hoc because it does not rely on a pre existing infrastructure, such as routers in wired networks or access points in managed (infrastructure) wireless networks. Instead, each node participates in routing by forwarding data for other nodes, so the determination of which nodes forward data is made dynamically on the basis of network connectivity. In addition to the classic routing, ad hoc networks can use flooding for forwarding data.
Wireless mobile ad hoc networks are self-configuring, dynamic networks in which nodes are free to move. Wireless networks lack the complexities of infrastructure setup and administration, enabling devices to create and join networks "on the fly" – anywhere, anytime." [Wireless ad hoc network. Wikipedia]
The infographic example "Conventional and wireless ad hoc network" was created using the ConceptDraw PRO diagramming and vector drawing software extended with the Computers and Communications solution from the Illustration area of ConceptDraw Solution Park.
Network infographic
SWOT Matrix Template

Geo Map - Asia - Papua New Guinea

Process Flowchart


Pyramid Diagram

Pyramid Diagram

Diagramming tool - Amazon Web Services and Cloud Computing Diagrams

Pyramid Diagram

Diagramming Software for Design UML Communication Diagrams


Pyramid Diagram

Flowchart design. Flowchart symbols, shapes, stencils and icons


Business Productivity - Marketing

Digital Communications Network. Computer and Network Examples


Geo Map - Europe - Bulgaria

- Business Communication Png
- Communication Satellite Dish Png
- Icon System Png Android
- Business Communication Clipart Png
- Communication Tower Png
- Network Diagram Communication Network Architecture Png
- Satellite Waves Png
- Diagram Of Communication Tower
- Traffic Cars Png
- Video Disk Png
- Visible light communication | Road transport - Vector stencils library ...
- Radio Waves Png Clipart
- Internet Cloud Png
- Android Icons Png
- Networking Equipment Images Png Hd
- Telecommunication Png
- Wireless Communication Symbol Png
- Network Tower Png
- Computer Vector Graphics Png
- Communication medium diagram | How to Create a Social Media ...