How to Create a Column Chart

Chart Maker for Presentations

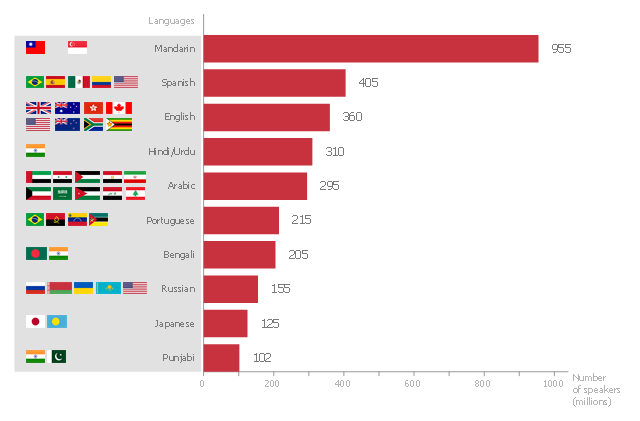
This bar graph sample shows the number of speakers for the most spoken languages of the world.
"In the philosophy of language, a natural language (or ordinary language) is any language which arises in an unpremeditated fashion as the result of the innate facility for language possessed by the human intellect. A natural language is typically used for communication, and may be spoken, signed, or written. Natural language is distinguished from constructed languages and formal languages such as computer-programming languages or the "languages" used in the study of formal logic, especially mathematical logic. ... Though the exact definition varies between scholars, natural language can broadly be defined in contrast on the one hand to artificial or constructed languages, computer programming languages like Python and international auxiliary languages like Esperanto, and on the other hand to other communication systems in nature, such as the waggle dance of bees. Although there are a variety of natural languages, any cognitively normal human infant is able to learn any natural language. By comparing the different natural languages, scholars hope to learn something about the nature of human intelligence and the innate biases and constraints that shape natural language, which are sometimes called universal grammar. The term "natural language" refers only a language that has developed naturally, and hence to actual speech, rather than prescribed speech. Hence, unstandardized speech (such as African American Vernacular English) is natural, whereas standardized speech such as Standard American English, which is in part prescribed, is somewhat artificial." [Natural language. Wikipedia]
The horizontal bar chart example "The most spoken languages of the world" was created using the ConceptDraw PRO diagramming and vector drawing software extended with the Bar Graphs solution from the Graphs and Charts area of ConceptDraw Solution Park.
Horizontal bar graph
Examples of Flowcharts, Org Charts and More


Chart Software for Better Presentations

Best Vector Drawing Application for Mac OS X

Fundraising Pyramid

Vertical Cross Functional Flowchart

Basic Diagramming


How to Create a Scatter Chart

What Is a Line Chart

How to Create Presentation of Your Project Gantt Chart

How to Create a Pyramid Diagram

Simple Drawing Applications for Mac

Bar Graph

- How To Explain A Marketing Pie Chart Bar Chart
- Explain Bar Chart Axis Example
- Draw And Explain The Flow Chart For The Design Of Column
- Sales Growth. Bar Graphs Example | Bar Chart Examples | Business ...
- Explanation Of The Uses Of Bar Graph By Using Sales
- A Draw And Explain The Flow Chart For The Design Of Column
- Business Report Pie. Pie Chart Examples | Bar Chart Examples ...
- Flowcharts | IDEF0 Diagrams | Explain Product Life Cycle Bar Graph
- Column Chart Software | Technical Flow Chart Example | Cross ...
- How to Create a Line Chart | Column Chart Software | Design ...
- Horizontal bar chart - The most spoken languages of the world ...
- Sales Growth. Bar Graphs Example | Bar Chart Examples | Create ...
- Bar Diagrams for Problem Solving. Create manufacturing and ...
- Bar Pie Flow Table Chart With Example Explanation
- Bar Graphs | Sales Growth. Bar Graphs Example | Line Graphs ...
- How to Create a Column Chart | How to Create a Line Chart | How to ...
- Bar Graphs | Process Flowchart | Column Chart Software ...
- Bar Graph | Column Chart Software | Design elements ...
- Rainfall Bar Chart | Bar Chart Template for Word | Bar Chart ...
- Flowchart Examples and Templates | Column Chart Software | Easy ...