Entity Relationship Diagram Software Engineering

 Entity-Relationship Diagram (ERD)
An Entity-Relationship Diagram (ERD) is a visual presentation of entities and relationships. That type of diagrams is often used in the semi-structured or unstructured data in databases and information systems. At first glance ERD is similar to a flowch
"An ER model is an abstract way of describing a database. In the case of a relational database, which stores data in tables, some of the data in these tables point to data in other tables - for instance, your entry in the database could point to several entries for each of the phone numbers that are yours. The ER model would say that you are an entity, and each phone number is an entity, and the relationship between you and the phone numbers is 'has a phone number'. Diagrams created to design these entities and relationships are called entity–relationship diagrams or ER diagrams.
Using the three schema approach to software engineering, there are three levels of ER models that may be developed. ...
Conceptual data model ... is the highest level ER model in that it contains the least granular detail but establishes the overall scope of what is to be included within the model set.
Logical ER model ... contains more detail than the conceptual ER model. In addition to master data entities, operational and transactional data entities are now defined.
The physical ER model is normally developed to be instantiated as a database. Therefore, each physical ER model must contain enough detail to produce a database and each physical ER model is technology dependent since each database management system is somewhat different.
Physical model ... is normally forward engineered to instantiate the structural metadata into a database management system as relational database objects such as database tables, database indexes such as unique key indexes, and database constraints such as a foreign key constraint or a commonality constraint." [Entity–relationship model. Wikipedia]
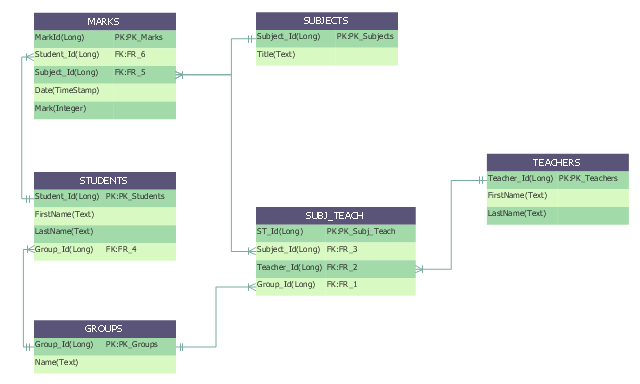
This crow's foot entity-relationship diagram (ERD) example "Educational data base" was created using the ConceptDraw PRO diagramming and vector drawing software extended with the Entity-Relationship Diagram (ERD) solution from the Software Development area of ConceptDraw Solution Park.
Using the three schema approach to software engineering, there are three levels of ER models that may be developed. ...
Conceptual data model ... is the highest level ER model in that it contains the least granular detail but establishes the overall scope of what is to be included within the model set.
Logical ER model ... contains more detail than the conceptual ER model. In addition to master data entities, operational and transactional data entities are now defined.
The physical ER model is normally developed to be instantiated as a database. Therefore, each physical ER model must contain enough detail to produce a database and each physical ER model is technology dependent since each database management system is somewhat different.
Physical model ... is normally forward engineered to instantiate the structural metadata into a database management system as relational database objects such as database tables, database indexes such as unique key indexes, and database constraints such as a foreign key constraint or a commonality constraint." [Entity–relationship model. Wikipedia]
This crow's foot entity-relationship diagram (ERD) example "Educational data base" was created using the ConceptDraw PRO diagramming and vector drawing software extended with the Entity-Relationship Diagram (ERD) solution from the Software Development area of ConceptDraw Solution Park.
ERD
 Block Diagrams
Block diagrams solution extends ConceptDraw DIAGRAM software with templates, samples and libraries of vector stencils for drawing the block diagrams.
UML Use Case Diagram Example. Registration System

DFD Flowchart Symbols

Entity Relationship Diagram Examples

 Fishbone Diagrams
The Fishbone Diagrams solution extends ConceptDraw DIAGRAM software with the ability to easily draw the Fishbone Diagrams (Ishikawa Diagrams) to clearly see the cause and effect analysis and also problem solving. The vector graphic diagrams produced using this solution can be used in whitepapers, presentations, datasheets, posters, and published technical material.
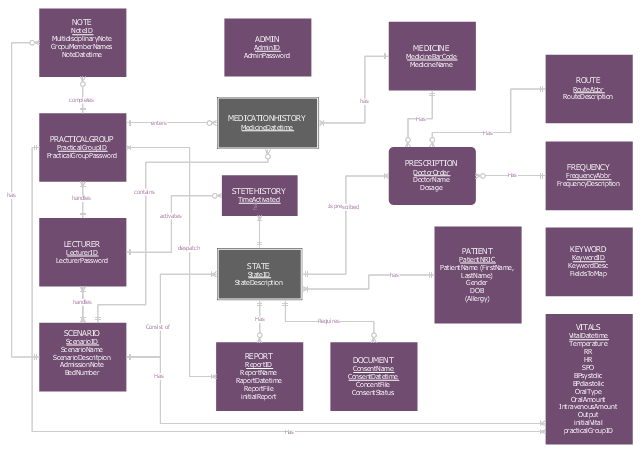
This ERD example was designed on the base of the entity-relationship diagram on the webpage "IS480 Team wiki: 2015T1 WhitePinnacle Documentation" from the Singapore Management University website. [wiki.smu.edu.sg/ is480/ IS480_ Team_ wiki%3A_ 2015T1_ WhitePinnacle_ Documentation]
This is ERD from the documentation of the High School Emergency Medical Responder (HS EMR) information system.
"Emergency medical responders are people who are specially trained to provide out-of-hospital care in medical emergencies. There are many different types of emergency medical responders, each with different levels of training, ranging from first aid and basic life support. Emergency Medical Responders have a very limited scope of practice and have the least amount of comprehensive education, clinical experience or clinical skills of EMS personnel. The Emergency Medical Responder (EMR) is not meant to replace the roles of Emergency Medical Technicians, Emergency Medical Technologists or Paramedics and their wide range of specialities. Emergency Medical Responders typically assist in rural regions providing basic life support where pre-hospital health professionals are not available due to limited resources or infrastructure." [Emergency medical responder. Wikipedia]
The example "Entity-Relationship Diagram" was drawn using ConceptDraw PRO software extended with the Entity-Relationship Diagram (ERD) solution from the Software Development area of ConceptDraw Solution Park.
ERD
UML Class Diagram Example for Transport System

Booch OOD Diagram

UML Class Diagram Notation

 Healthcare Management Workflow Diagrams
Healthcare Management Workflow Diagrams solution contains large set of colorful samples and libraries with predesigned vector pictograms and symbols of health, healthcare equipment, medical instruments, pharmaceutical tools, transport, medication, departments of healthcare organizations, the medical icons of people and human anatomy, as well as the predesigned flowchart objects, connectors and arrows, which make it the best for designing clear and comprehensive Medi?al Workflow Diagrams and Block Diagrams, Healthcare Management Flowcharts and Infographics, Healthcare Workflow Diagram, for depicting the healthcare workflow and clinical workflows in healthcare, for making the workflow analysis healthcare and healthcare workflow management.
Physical Activity Plan

Software development with ConceptDraw DIAGRAM

UML Deployment Diagram. Design Elements

 Fault Tree Analysis Diagrams
This solution extends ConceptDraw DIAGRAM.5 or later with templates, fault tree analysis example, samples and a library of vector design elements for drawing FTA diagrams (or negative analytical trees), cause and effect diagrams and fault tree diagrams.
 Plan-Do-Check-Act (PDCA)
Plan-Do-Check-Act (PDCA) solution extends the ConceptDraw DIAGRAM software with collection of samples and predesigned vector objects for easy visualization four stages of PDCA cycle, PDSA cycle, or Deming cycle, for illustration effective application of this method to the practical business tasks, for depiction the implementation of changes and solution the problems in business processes. Plan-Do-Check-Act (PDCA) solution helps to design professional-looking and attractive Plan Do Study Act diagrams, PDCA cycle diagrams, PDCA Process diagrams, and to construct the Quality Management Process Models, which all assist to manage efficiently the business processes, to improve quality of work and to reduce significantly the costs.
CORRECTIVE ACTIONS PLANNING. Risk Diagram (PDPC)
 *")

What is Entity-Relationship Diagram

- Entity-Relationship Diagram ( ERD ) | College Management System ...
- College Management System Er Diagram In Dbms Pdf
- Er Diagram For College Management System Ppt
- Erd Case Study For College Management System
- ER Diagram Of School Management System Pdf
- Er Diagram For College Database Management System
- Er Diagram For School Management System Pdf
- Simple Library Management System Database With Er Diagram In Pdf
- School Management System ER Diagram
- Er Diagram Examples For School Management
- Er Diagram For College Management System In Dbms
- Er Diagram For Library Management System Of College
- College Management System Uml Diagrams Pdf
- Er Diagram For College Management System Pdf
- Entity-Relationship Diagram ( ERD ) | E R Daigram College Managment
- School Management System Database Schema With Entity
- Er Diagram College Management System Images
- Entity Relationship Diagram For College Management System
- Network Management System Er Diagram
- Use Case Diagram For College Management System Pdf