This site uses cookies. By continuing to browse the ConceptDraw site you are agreeing to our Use of Site Cookies.

Bubble diagrams in Landscape Design with ConceptDraw DIAGRAM

To define the links between the different areas of your own landscape design and see the project from aside, we recommend to draw landscape diagram called bubble one which is analogue of «mind maps» as it allows us to create approximate image of our future proper landscape view. Use special libraries (and we have plenty of them) with objects of landscape design to be able to create the detailed plan of your landscape which will be looking so smart and professionally good as the samples we provide were created by designers who know so much about making such kinds of design plans. Having ConceptDraw DIAGRAM as the assistant in your work, will ensure the success after using our product. Make the bubble diagrams as well as any other ones in minutes with ease having our application called ConceptDraw DIAGRAM and you will see how quick it will change your life simplifying lots of work.

ConceptDraw Solution Park ConceptDraw Solution Park

ConceptDraw Solution Park
ConceptDraw Solution Park collects graphic extensions, examples and learning materials

event-driven process chain diagram, EPC diagram, process chain flowchart Event-driven Process Chain Diagrams

event-driven process chain diagram, EPC diagram, process chain flowchart
Event-Driven Process Chain Diagrams solution extends ConceptDraw DIAGRAM functionality with event driven process chain templates, samples of EPC engineering and modeling the business processes, and a vector shape library for drawing the EPC diagrams and EPC flowcharts of any complexity. It is one of EPC IT solutions that assist the marketing experts, business specialists, engineers, educators and researchers in resources planning and improving the business processes using the EPC flowchart or EPC diagram. Use the EPC solutions tools to construct the chain of events and functions, to illustrate the structure of a business process control flow, to describe people and tasks for execution the business processes, to identify the inefficient businesses processes and measures required to make them efficient.

sales process map, sales process flowchart, sales steps, sales process management Sales Flowcharts

sales process map, sales process flowchart, sales steps, sales process management
The Sales Flowcharts solution lets you create and display sales process maps, sales process workflows, sales steps, the sales process, and anything else involving sales process management.
HelpDesk

How To Convert a Block Diagram to Adobe PDF

ConceptDraw DIAGRAM allows you to easily share your business documentation between different computers with different operating systems and applications using its export capabilities. You can get a clear business graphic pack in pdf format and avoid any problems while communicating them with stakeholders.

organizational chart, org chart Organizational Charts

organizational chart, org chart
Organizational Charts solution extends ConceptDraw DIAGRAM software with samples, templates and library of vector stencils for drawing the org charts.
HelpDesk

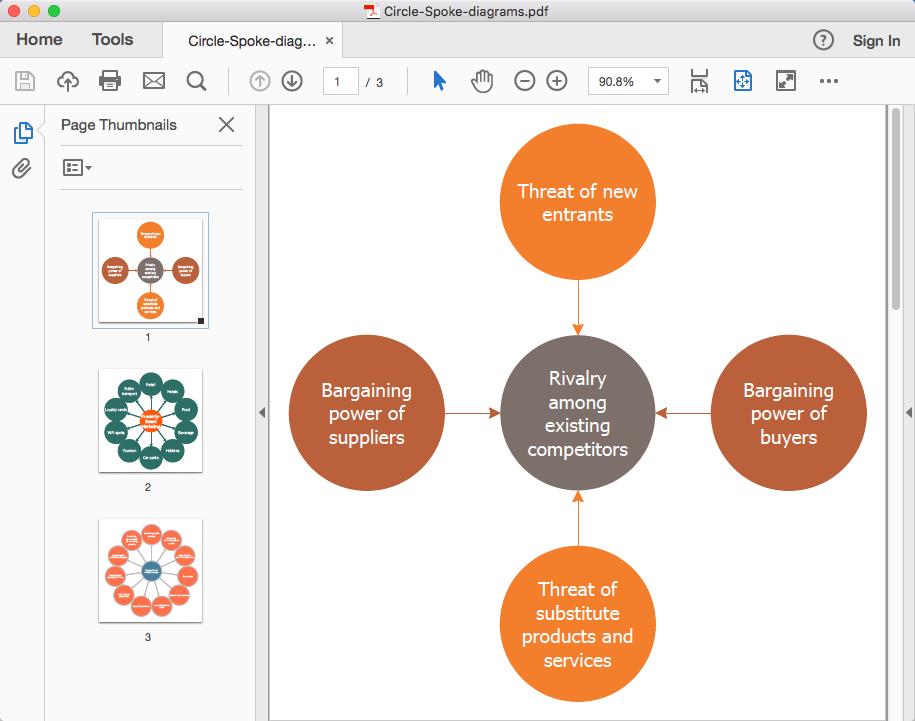
How To Convert a Circle-Spoke Diagram to Adobe PDF

ConceptDraw DIAGRAM allows you to easily share your marketing documentation between different computers with different operating systems and applications using its export capabilities. You can get your marketing diagrams in pdf format and avoid any problems while communicating them.
HelpDesk

How to Diagram Sentences

Diagramming sentences is a playful, fun way of learning English Grammer. Sentences can be very complex and can contain many different parts of speech which implicate many different grammatical rules. Diagramming sentences will help you to make sure every part of your sentence are grammatically correct and provides you with a more comprehensive understanding of the English Language. A Sentence Diagram displays the parts of a sentence as a diagram in order to show the relationship of words and groups of words within the sentence. Sentence Diagram shows the relationship between the proposal of its parts. This is a good way to teach grammar! Sentence Diagram helps to make the writing more coherent as well as more interesting to read. ConceptDraw DIAGRAM allows you to create clear sentence diagrams using the special templates and vector stencils library.
HelpDesk

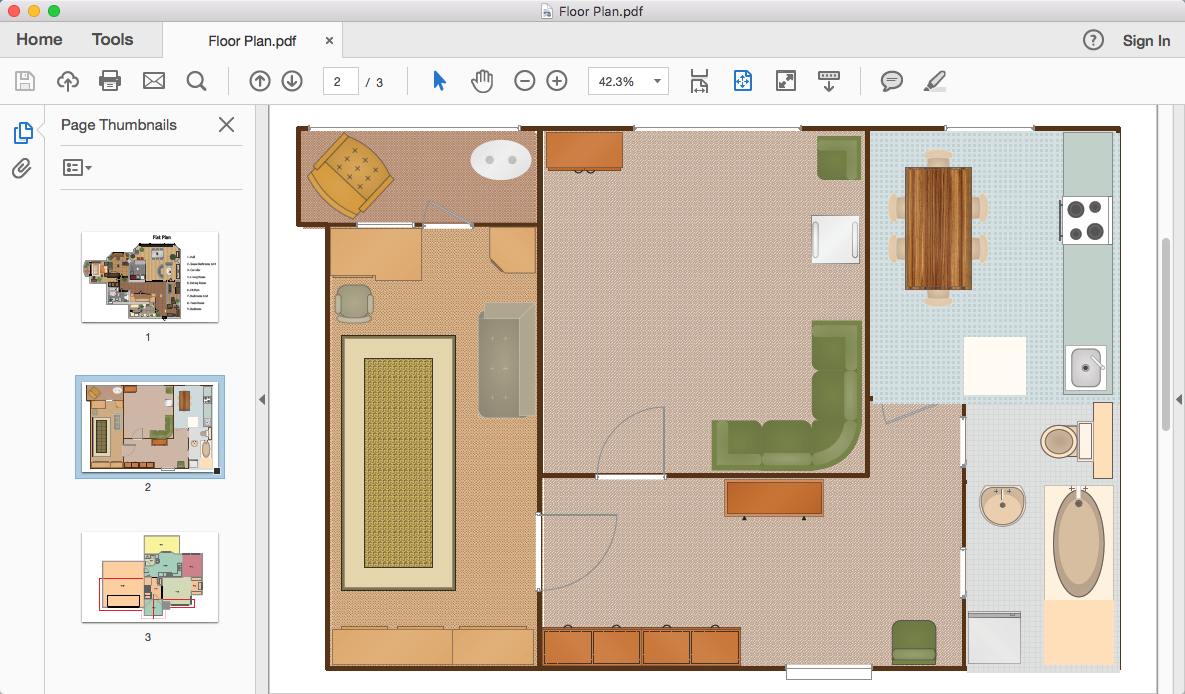
How To Convert a Floor Plan to Adobe PDF

ConceptDraw DIAGRAM allows you to easily share your building plans between different computers with different operating systems and applications using its export capabilities. You can get clear floor plan in pdf format and avoid any problems while communicating them with your Customers and Contractors.

segmented cycle diagram, marketing diagrams, circular arrows diagrams Circular Arrows Diagrams

segmented cycle diagram, marketing diagrams, circular arrows diagrams
Circular Arrows Diagrams solution extends ConceptDraw DIAGRAM with extensive drawing tools, predesigned samples, Circular flow diagram template for quick start, and a library of ready circular arrow vector stencils for drawing Circular Arrow Diagrams, Segmented Cycle Diagrams, and Circular Flow Diagrams. The elements in this solution help managers, analysts, business advisers, marketing experts, scientists, lecturers, and other knowledge workers in their daily work.
HelpDesk

How to Create a Data Flow Diagram

Data flow diagramming is a highly effective technique for showing the flow of information through a system. Data flow diagrams reveal relationships among and between the various components in a program or system. DFD is an important technique for modeling a system’s high-level detail by showing how input data is transformed to output results through a sequence of functional transformations. The set of standard symbols is used to depict how these components interact in a system. ConceptDraw DIAGRAM allows you to draw a simple and clear Data Flow Diagram using special libraries.
HelpDesk

How to Draw a Flat Organizational Chart

A clear organizational chart helps you to understand the relationships of positions in an organization in terms of authority and responsibility. A Flat organizational structure is one of the most typical organizational structure. Use The Flat Organizational chart template to draw the organizational structure of your company. ConceptDraw 25 Typical Orgcharts solution provides you with the possibility to develop typical organizational charts quickly and easily.
HelpDesk

How to Create a Telecommunication Network Diagram

Telecommunication network diagram displays components and connections in a telecommunication network: how they are interacted between each other and with end-users. Telecommunication network diagrams usually created by system engineers for planning telecom networks. Also, they may be useful for network management. Telecom network diagram visualizes the level of security and user access to certain equipment and data within a current network. Telecom network diagram can be used to identify weak points of an entire network or a part of it. ConceptDraw DIAGRAM allows you to draw a simple and clear Telecommunication Network diagrams.
HelpDesk

How to Add a Cross-Functional Flowchart to Adobe PDF

ConceptDraw DIAGRAM allows you to easy share your business process documentation between different computers with different operating systems and applications using it's export capabilities. You can get your cross-functional flowcharts in pdf format and avoid any problems while communicating them.
HelpDesk

How to Draw an Area Chart

An area chart is similar to a line chart, but an area chart has an area, commonly filled with color below the line. The applying of Line charts and area charts are also very similar. They both show continuity across a data set. They are both can be used for displaying time series data and for depicting tendencies better than separate values, but they have some different characteristics. Using the proper one is good chance to show once again professionalism of your graphics documents. An area chart depicts a colored area below the line. The sum on the vertical axis of an area chart represents the entire value, while the height of each separate piece shows its parts. Area charts are used to display multiple data series with proportion to a whole value, or for separate data series showing a set of countable values, or cumulative data.
HelpDesk

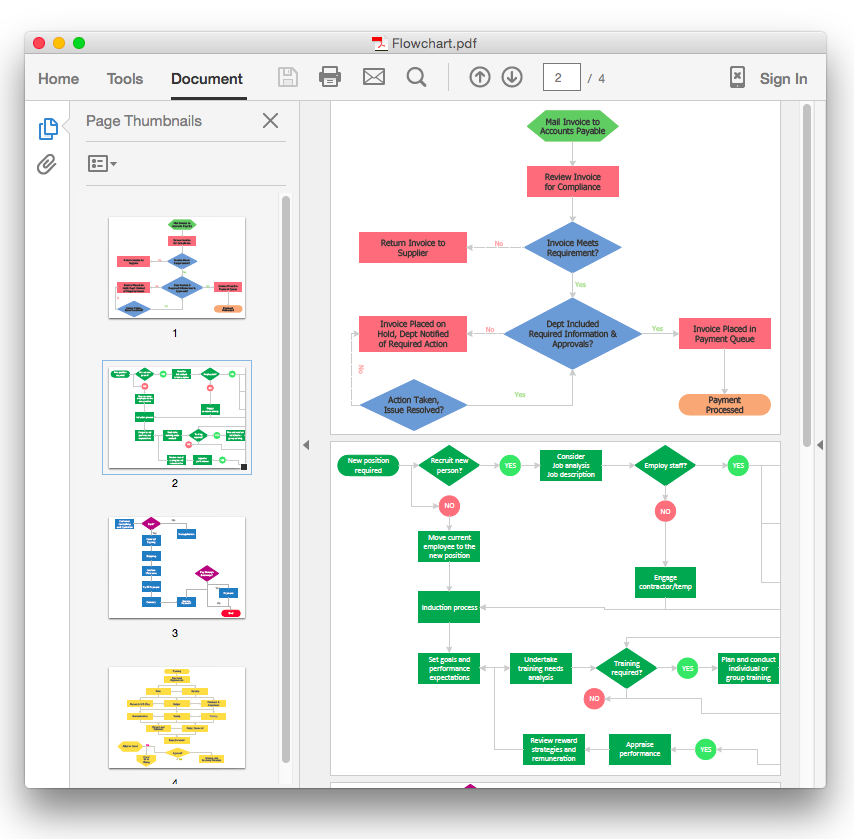
How To Convert a Flowchart to Adobe PDF

ConceptDraw DIAGRAM allows you to easy exchange your drawings between different computers with different operating systems and applications using it's export capabilities. You can get clear business documentation in pdf format and avoid any problems while communicating it with stakeholders.
HelpDesk

How to Draw an Organizational Chart

Polish your diagram appearance using the tools provided in the Format panel. The organizational chart software is a valuable tool for modern business. It is important for any business to build a clear organizational structure that determines the responsibilities and relationships between different positions in the organization. The clear structured organization - means the clear structured business workflow, which is the core of success in the business. ConceptDraw DIAGRAM is an org chart software that allows you to draw an organizational structure of your company quickly and easily.
HelpDesk

How to Draw a Pie Chart

A pie chart represents data, in a clear and easy to read around (pie) form. A circular pie chart is divided into sections (slice). Each "slice" depicts the It reflects the proportion of each component in the whole "pie". This type of chart is most often used for the visualization of statistical data. That is why pie charts are widely used in marketing. As the pie charts show proportional parts of a whole, they are good for various visual comparisons. For example, it is difficult to imagine a more intuitive way to show segmentation and market share. ConceptDraw DIAGRAM allows you to draw a simple and clear Pie Chart using the Pie Charts solution.

atm solutions,uml examples, uml example, uml diagram creator, best uml tool, banking system ATM UML Diagrams

atm solutions,uml examples, uml example, uml diagram creator, best uml tool, banking system
The ATM UML Diagrams solution lets you create ATM solutions and UML examples. Use ConceptDraw DIAGRAM as a UML diagram creator to visualize a banking system.

cross-functional flowchart template, flowchart, example business process flow Cross-Functional Flowcharts

cross-functional flowchart template, flowchart, example business process flow
Cross-functional flowcharts are powerful and useful tool for visualizing and analyzing complex business processes which requires involvement of multiple people, teams or even departments. They let clearly represent a sequence of the process steps, the order of operations, relationships between processes and responsible functional units (such as departments or positions).