 25 Typical Orgcharts
The 25 Typical Orgcharts solution contains powerful organizational structure and organizational management drawing tools, a variety of professionally designed organization chart and matrix organization structure samples, 25 templates based on various orga
 ConceptDraw Solution Park
ConceptDraw Solution Park collects graphic extensions, examples and learning materials
HelpDesk
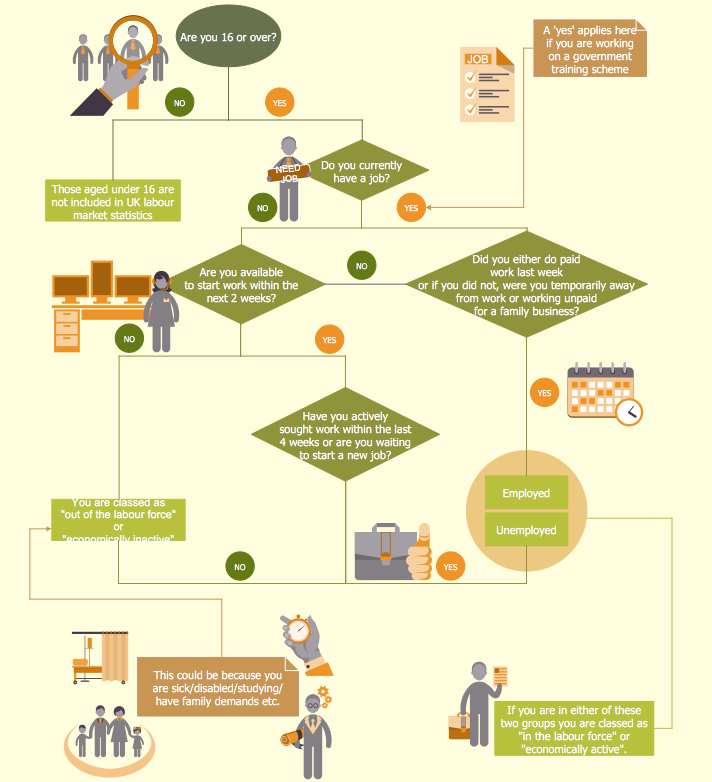
How to Create a HR Process Flowchart
Business diagrams & Org Charts with ConceptDraw DIAGRAM


HelpDesk
How to Draw a Gantt Chart

HelpDesk
How to Publish Project Reports to a Web Site

HelpDesk
How to Create a Timeline Diagram

HelpDesk
Event-driven Process Chain (EPC) Diagram Software

HelpDesk
How to Create a Data Flow Diagram

- Organizational Chart For Restaurant Business
- Organizational Chart Sample Restaurant
- How to Draw an Organization Chart | How to Draw an ...
- Organizational Charts | How to Create a HR Process Flowchart ...
- How To Create Restaurant Floor Plan in Minutes | Gantt Chart ...
- Restaurant Organizational Chart
- How to Draw an Organization Chart | Organizational Charts with ...
- Seven Management and Planning Tools | Property Management ...
- Gant Chart in Project Management | How to Create Presentation of ...
- Organizational Chart Template | Orgchart | Organizational Charts ...
- Organization Chart Templates | Organizational Charts with ...
- Organization Chart Software | Pie Chart Software | Process ...
- Management Org Charts
- Organizational Structure | Organizational Charts with ConceptDraw ...
- Gant Chart in Project Management | Project —Task Trees and ...
- Gant Chart in Project Management | How to Create Presentation of ...
- Gantt charts for planning and scheduling projects | Gant Chart in ...
- Project Management Sample Schedule
- Organizational Chart Template | Organizational Structure | Marketing ...