This circle-spoke diagram sample shows the social determinants of health. It was created on the base of the hub-and-spoke diagram from the Health Canada website. [hc-sc.gc.ca/ sr-sr/ pubs/ hpr-rpms/ bull/ 2005-climat/ 2005-climat-6-eng.php]
"Social determinants of health are the economic and social conditions – and their distribution among the population – that influence individual and group differences in health status. They are risk factors found in one's living and working conditions (such as the distribution of income, wealth, influence, and power), rather than individual factors (such as behavioural risk factors or genetics) that influence the risk for a disease, or vulnerability to disease or injury. According to some viewpoints, these distributions of social determinants are shaped by public policies that reflect the influence of prevailing political ideologies of those governing a jurisdiction. ...
In 2003, the World Health Organization (WHO) Europe suggested that the social determinants of health included:
(1) Social gradients (life expectancy is shorter and disease is more common further down the social ladder).
(2) Stress (including stress in the workplace).
(3) Early childhood development.
(4) Social exclusion.
(5) Unemployment.
(6) Social support networks.
(7) Addiction.
(8) Availability of healthy food.
(9) Availability of healthy transportation." [Social determinants of health. Wikipedia]
The hub-and-spoke diagram example "Social determinants of health" was created using the ConceptDraw PRO diagramming and vector drawing software extended with the Circle-Spoke Diagrams solution from the area "What is a Diagram" of ConceptDraw Solution Park.
Circle-spoke diagram

Circle Diagrams

 Business Diagrams
The Business Diagrams Solution extends ConceptDraw DIAGRAM v12 with an extensive collection of professionally designed illustrative samples and a wide variety of vector stencils libraries, which are the real help for all business-related people, business analysts, business managers, business advisers, marketing experts, PR managers, knowledge workers, scientists, and other stakeholders allowing them to design the bright, neat, expressive and attractive Bubble Diagrams, Circle-Spoke Diagrams, Circular Arrows Diagrams, and Venn Diagrams with different quantity of sets in just minutes; and then successfully use them in documents, reports, statistical summaries, and presentations of any style.
What Is a Circle Spoke Diagram

Circles Venn Diagram

Circle Spoke Diagram Template

HelpDesk
How to Add a Circle-Spoke Diagram to MS Word Document

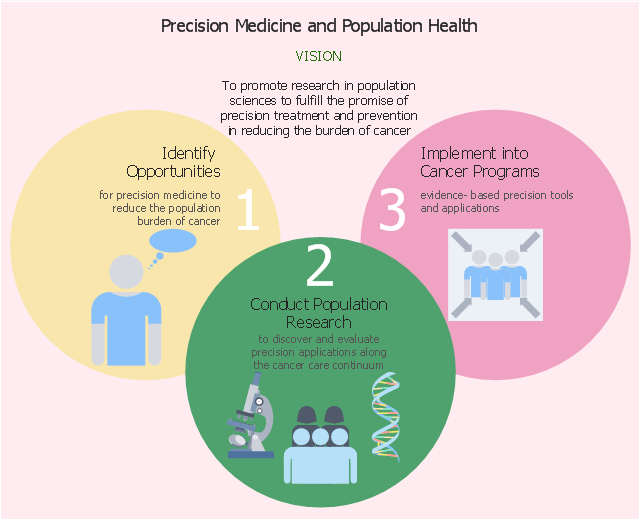
This biomedical infographic sample was designed on the base of the diagram on the webpage "Precision Medicine & Population Health" from the website of the Division of Cancer Control and Population Sciences (DCCPS) of the National Cancer Institute. [cancercontrol.cancer.gov/ research-emphasis/ precision-medicine.html]
"Precision medicine (PM) is a medical model that proposes the customization of healthcare, with medical decisions, treatments, practices, or products being tailored to the individual patient. In this model, diagnostic testing is often employed for selecting appropriate and optimal therapies based on the context of a patient’s genetic content or other molecular or cellular analysis. Tools employed in precision medicine can include molecular diagnostics, imaging, and analytics." [Precision medicine. Wikipedia]
"Population health ... is an approach to health that aims to improve the health of an entire human population. ... A priority considered important in achieving the aim of Population Health is to reduce health inequities or disparities among different population groups due to, among other factors, the social determinants of health, SDOH. The SDOH include all the factors (social, environmental, cultural and physical) that the different populations are born into, grow up and function with throughout their lifetimes which potentially have a measurable impact on the health of human populations. The Population Health concept represents a change in the focus from the individual-level, characteristic of most mainstream medicine." [Population health. Wikipedia]
The healthcare infographic example "Precision Medicine and Population Health" was designed using ConceptDraw PRO software extended with Biomedicine solution from Health area of ConceptDraw Solution Park.
Healthcare infographic
3 Circle Venn Diagram. Venn Diagram Example

Multi Layer Venn Diagram. Venn Diagram Example

- Social determinants of health | Circle -Spoke Diagrams | Circle ...
- Social determinants of health | CEEBL structure | Circle -Spoke ...
- Social determinants of health - Hub-and-spoke diagram | Circle ...
- Circle -Spoke Diagrams | Social Determinants Of Health Infographic
- Circle -Spoke Diagrams | Bubble Diagrams | Social Determinants Of ...
- How To Create a Visio Circle -Spoke Diagram Using ConceptDraw ...
- Social determinants of health | Circle -spoke diagram - Vector ...
- Social determinants of health
- Chart Determinants Of Health
- Circle -Spoke Diagrams | Social determinants of health | What Is a ...