Basic Flowchart Symbols and Meaning


ERD Symbols and Meanings


HelpDesk
How to Create Flowchart Using Standard Flowchart Symbols

What Is a Circle Spoke Diagram

Entity Relationship Diagram Symbols

The Circular Flow Diagram

Definition Flowchart

Donut Chart

Circle Diagrams

Funnel Diagram

In order to make a funnel diagram, the Funnel Diagrams solution can be used while working in the ConceptDraw DIAGRAM diagramming and drawing software. Having the pre-made design elements as well as the examples of funnel diagrams, the Funnel Diagrams solution allows any ConceptDraw DIAGRAM user to make their own unique as well as professionally-looking drawings.
Circle Spoke Diagram Template

2 Circle Venn Diagram. Venn Diagram Example

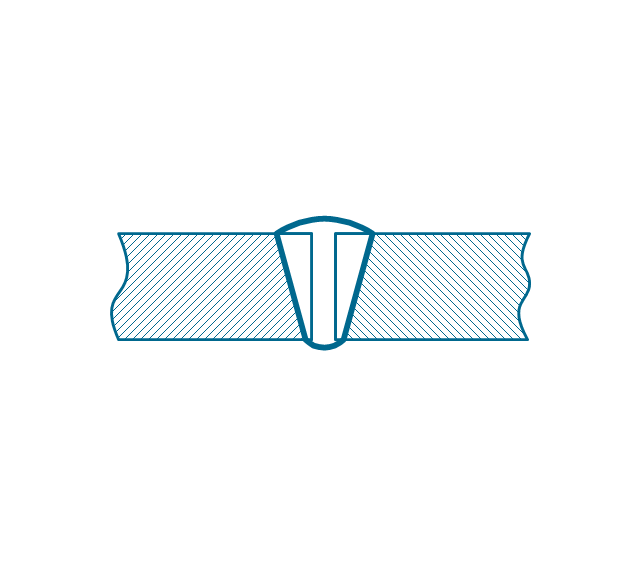
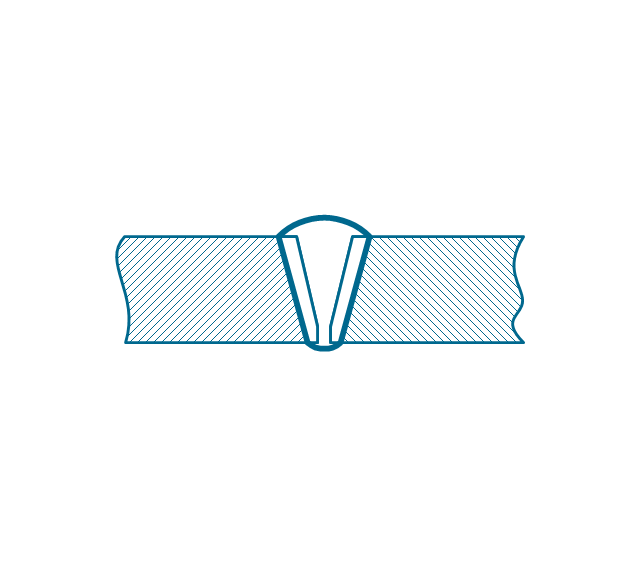
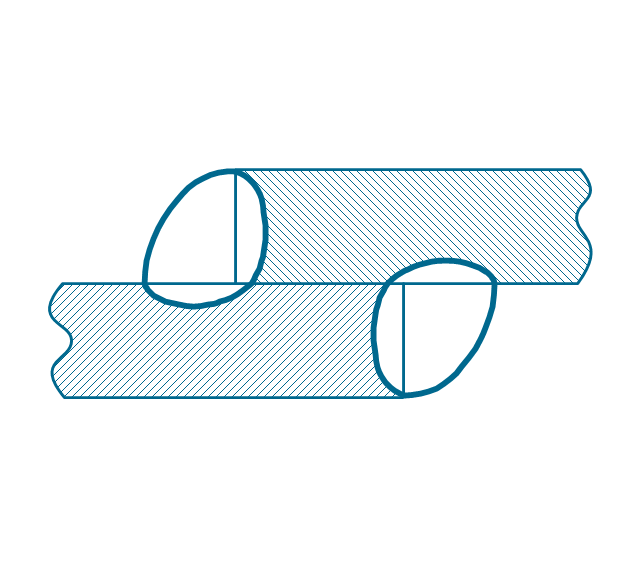
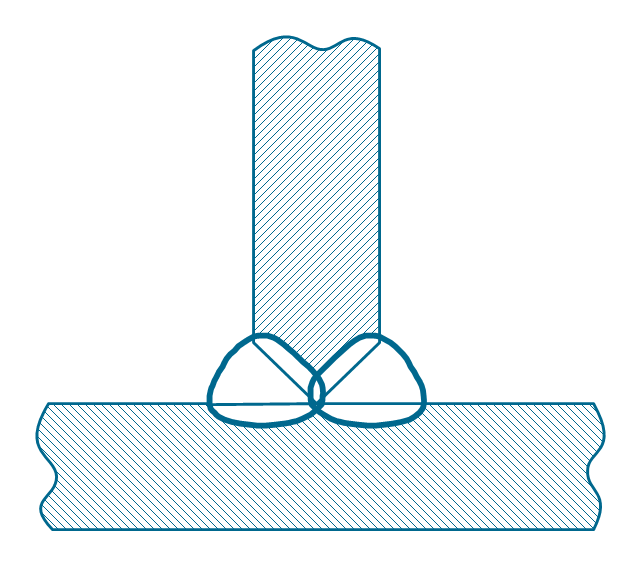
The vector stencils library "Welding" contains 38 welding joint symbols to identify fillets, contours, resistance seams, grooves, surfacing, and backing.
Use it to indicate welding operations on working drawings in the ConceptDraw PRO diagramming and vector drawing software extended with the Mechanical Engineering solution from the Engineering area of ConceptDraw Solution Park.
www.conceptdraw.com/ solution-park/ engineering-mechanical
Use it to indicate welding operations on working drawings in the ConceptDraw PRO diagramming and vector drawing software extended with the Mechanical Engineering solution from the Engineering area of ConceptDraw Solution Park.
www.conceptdraw.com/ solution-park/ engineering-mechanical
Additional arrow
Text block
Fillet

Slot / plug

Stud

Resistance seam

Backing

Surfacing

Flange corner

Flange edge

Square groove

V-groove

Bevel groove

U-groove

J-groove

Flare V groove

Flare bevel groove

Scarf

Melt through weld

Field weld

Backing / spacer

Insert

Arrow with bend
Arrow with bend, tail
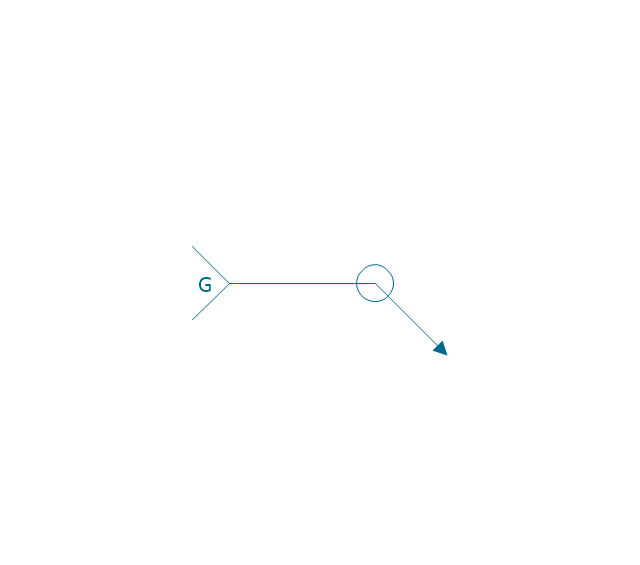
Arrow with bend, circle
Arrow with bend, circle, tail
Arrow
Arrow, tail
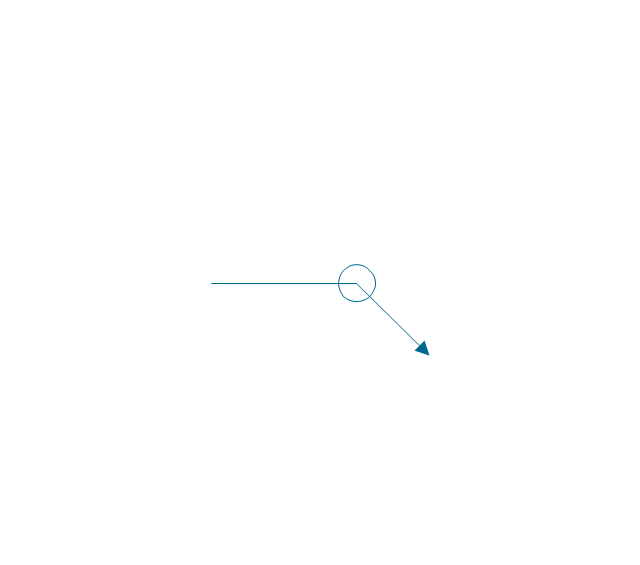
Arrow, circle
Arrow, circle, tail
Spot

Projection weld

Contour, concave

Contour, convex

Contour, flush

Contour angled, concave

Contour angled, convex

Contour angled, flush

Square butt weld

Closed square butt weld
Single-bevel butt weld

Double-bevel butt weld

Single-V butt weld

Double-V butt weld

Single-J butt weld

Double-J butt weld
Single-U butt weld

Double-U butt weld

Flange butt weld

Tee butt weld
Flare butt weld
Square butt joint
Single V preparation joint
Lap joint
T-joint
Butt weld
Butt weld, single-V
Bilateral lap weld
Tee weld
Angular weld

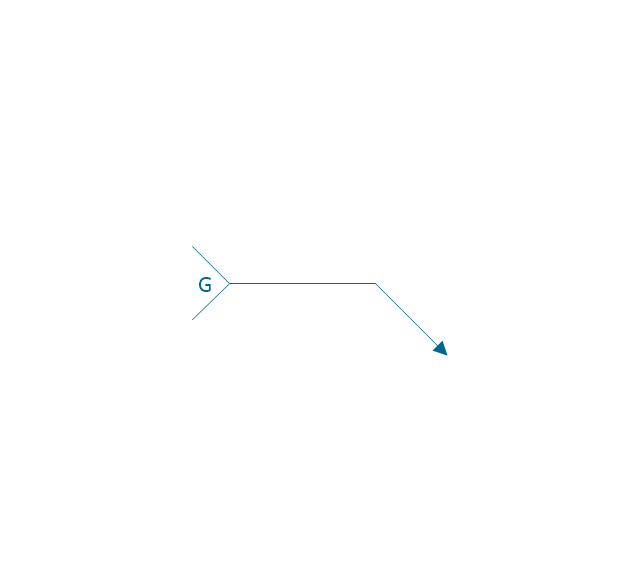
Mechanical weld
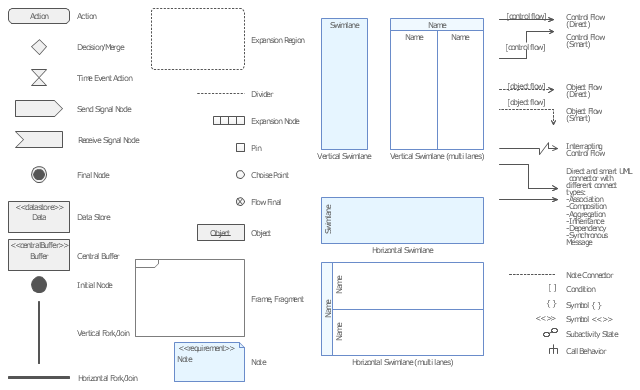
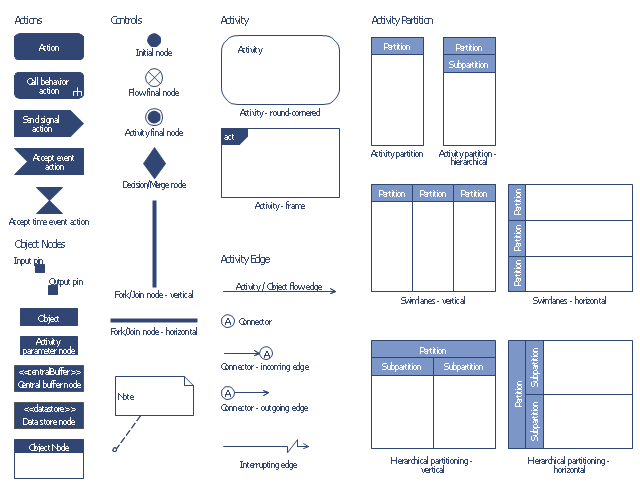
The vector stencils library "UML activity diagrams" contains 37 symbols for the ConceptDraw PRO diagramming and vector drawing software.
"Activity diagrams are constructed from a limited number of shapes, connected with arrows. The most important shape types:
(1) rounded rectangles represent actions;
(2) diamonds represent decisions;
(3) bars represent the start (split) or end (join) of concurrent activities;
(4) a black circle represents the start (initial state) of the workflow;
(5) an encircled black circle represents the end (final state).
Arrows run from the start towards the end and represent the order in which activities happen.
Hence they can be regarded as a form of flowchart. Typical flowchart techniques lack constructs for expressing concurrency. However, the join and split symbols in activity diagrams only resolve this for simple cases; the meaning of the model is not clear when they are arbitrarily combined with decisions or loops." [Activity diagram. Wikipedia]
The example "Design elements - UML activity diagrams" is included in the Rapid UML solution from the Software Development area of ConceptDraw Solution Park.
UML activity diagram symbols
Process Flow Chart Symbol

The vector stencils library "Bank UML activity diagram" contains 32 shapes of UML activity diagram.
Use it for object-oriented modeling of your bank information system.
"Activity diagrams are constructed from a limited number of shapes, connected with arrows. The most important shape types:
* rounded rectangles represent actions;
* diamonds represent decisions;
* bars represent the start (split) or end (join) of concurrent activities;
* a black circle represents the start (initial state) of the workflow;
* an encircled black circle represents the end (final state).
Arrows run from the start towards the end and represent the order in which activities happen.
Activity diagrams may be regarded as a form of flowchart. Typical flowchart techniques lack constructs for expressing concurrency. However, the join and split symbols in activity diagrams only resolve this for simple cases; the meaning of the model is not clear when they are arbitrarily combined with decisions or loops.
While in UML 1.x, activity diagrams were a specialized form of state diagrams, in UML 2.x, the activity diagrams were reformalized to be based on Petri net-like semantics, increasing the scope of situations that can be modeled using activity diagrams. These changes cause many UML 1.x activity diagrams to be interpreted differently in UML 2.x." [Activity diagram. Wikipedia]
This example of UML activity diagram symbols for the ConceptDraw PRO diagramming and vector drawing software is included in the ATM UML Diagrams solution from the Software Development area of ConceptDraw Solution Park.
UML activity diagram symbols
Circular Arrows

Process Flow Chart Symbols

Context Diagram Template

This template shows the Context Diagram. It was created in ConceptDraw DIAGRAM diagramming and vector drawing software using the Block Diagrams Solution from the “Diagrams” area of ConceptDraw Solution Park. The context diagram graphically identifies the system. external factors, and relations between them. It’s a high level view of the system. The context diagrams are widely used in software engineering and systems engineering for designing the systems that process the information.
Concept Maps

- Basic Flowchart Symbols and Meaning | Flowchart design ...
- Circular Flow Diagram Template | Basic Flowchart Symbols and ...
- Electrical Symbols , Electrical Diagram Symbols | Circle With Arrow ...
- Circular diagrams - Vector stencils library | Circular Arrows | What Is ...
- Basic Flowchart Symbols and Meaning | Entity Relationship ...
- Visio Circle Arrow
- Circular arrows diagrams - Vector stencils library | Triangle scheme ...
- Arrow circle chart - Template | How to Draw the Different Types of ...
- Circular Flow Diagram Template | Basic Flowchart Symbols and ...
- How to Draw a Circular Arrows Diagram Using ConceptDraw PRO ...
- Basic Flowchart Symbols and Meaning | Flowchart design ...
- Basic Flowchart Symbols and Meaning | Vicious circle - Crystal ...
- Circle Bullet
- Basic Flowchart Symbols and Meaning | Circular Flow Diagram ...
- Circular arrows diagrams - Vector stencils library | Circular diagrams ...
- Basic Flowchart Symbols and Meaning | How to Create a ...
- ERD Symbols and Meanings | Components of ER Diagram | ER ...
- Basic Flowchart Symbols and Meaning | How to Draw a Circle ...
- Basic Flowchart Symbols and Meaning | Types of Flowcharts | Total ...
- Curved Arrow Circle Clip Art