Basic Flowchart Symbols and Meaning


HelpDesk
How to Draw a Circle-Spoke Diagram Using ConceptDraw PRO

HelpDesk
How to Add a Circle-Spoke Diagram to MS Word Document

HelpDesk
How To Convert a Circle-Spoke Diagram to Adobe PDF

HelpDesk
How To Make Visio Circle-Spoke Diagram

Process Flow Chart Symbols

HelpDesk
How to Add a Circle-spoke Diagram to PowerPoint

HelpDesk
How to Create Flowchart Using Standard Flowchart Symbols

 Circle-Spoke Diagrams
Examples of subject areas that are well suited to this approach are marketing, business, products promotion, process modeling, market, resource, time, and cost analysis. Circle-Spoke Diagrams are successfully used in presentations, conferences, management documents, magazines, reportages, reviews, reports, TV, and social media.
The vector stencils library "Cross-functional flowcharts" contains 31 flow chart symbols. Use it for drawing cross-functional and deployment flowcharts the ConceptDraw PRO diagramming and vector drawing software extended with the Cross-Functional Flowcharts solution from the Business Processes area of ConceptDraw Solution Park.
Swimlanes Vertical

Swimlanes Horizontal

Terminator

Process

Decision

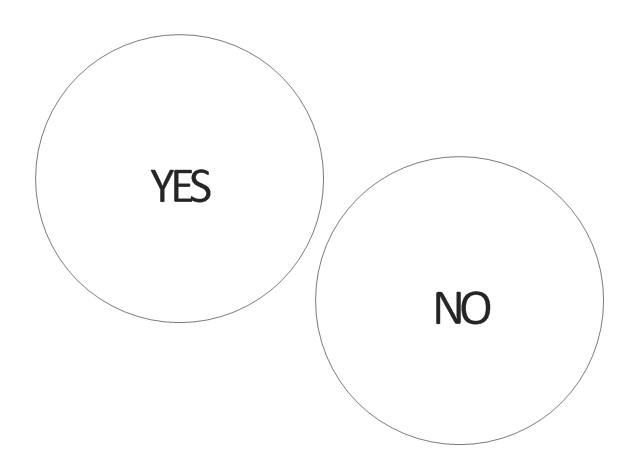
Yes

No

YES/NO
Data

Manual Operation

Document

Predefined Process

Stored Data

Internal Storage

Sequential Data

Direct Data

Manual Input

Card

Paper Tape

Display

Preparation

Parallel Mode

Loop limit

On-page Reference

Off-Page Reference (Outgoing)
-cross-functional-flowcharts---vector-stencils-library.png--diagram-flowchart-example.png)
Off-Page Reference (Incoming)
-cross-functional-flowcharts---vector-stencils-library.png--diagram-flowchart-example.png)
Off-page Reference (Circle)
-cross-functional-flowcharts---vector-stencils-library.png--diagram-flowchart-example.png)
Off-Page Reference (Arrow)
-cross-functional-flowcharts---vector-stencils-library.png--diagram-flowchart-example.png)
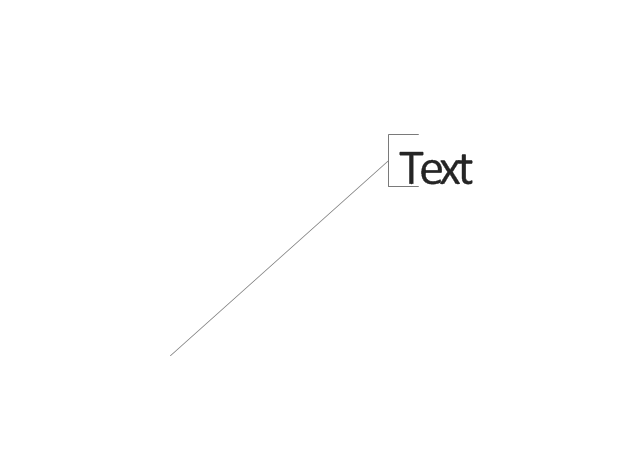
Annotation
Control Transfer

Condition

 HR Flowcharts
Human resource management diagrams show recruitment models, the hiring process and human resource development of human resources.
HelpDesk
How to Add a Concept Map to a PowerPoint Presentation

HelpDesk
How to Create a Timeline Diagram in ConceptDraw PRO

HelpDesk
How to Draw a Circular Arrows Diagram Using ConceptDraw PRO

HelpDesk
How to Create a Concept Map in ConceptDraw PRO

- Basic Flowchart Symbols and Meaning | Flowcharts | Circles Venn ...
- Circles In Flowchart Meaning
- Circle Flow Chart
- Basic Flowchart Symbols and Meaning | Circle Diagrams | Circle ...
- Types of Flowcharts | Material Requisition Flowchart . Flowchart ...
- How to Draw a Circle -Spoke Diagram Using ConceptDraw PRO ...
- Vicious circle - Crystal diagram
- Draw The Flowchart And Block Diagram Of Area Of Circle
- Organizational Charts | Basic Flowchart Symbols and Meaning | 25 ...
- Circular Arrows Diagrams | Flowcharts | Flow Chart Creator | Draw A ...
- Arrow circle chart - Template | How to Create Flowchart Using ...
- What Is A Flowchart In Accounting And Business With Circles And
- Free Circle Chart Diagram
- 3 Circle Venn. Venn Diagram Example | Process Flowchart | 3 Circle ...
- Make Circle Flow Charts Mac
- Basic Diagramming | Basic Network Diagram | Basic Circles Venn ...
- Circular Flow Diagram Template
- Process Flowchart | Block Diagram | How To Convert a Circle -Spoke ...
- Basic Flowchart Symbols and Meaning | Cycle of automobile ...
- Circle -spoke diagram - Target market | Process Flowchart | Global ...