This site uses cookies. By continuing to browse the ConceptDraw site you are agreeing to our Use of Site Cookies.

KPI Dashboard

ConceptDraw DIAGRAM diagramming and vector drawing software supplied with Sales Dashboard solution from the Marketing area of ConceptDraw Solution Park provides the full set of useful tools which make it the best for producing the live KPI Dashboard of any complexity.

Performance Indicators

ConceptDraw DIAGRAM diagramming and vector drawing software offers the useful tools of the Sales Dashboard solution from the Marketing area for easy creating professional looking live dashboards which allow to track the business sales activity and progress thanks to representing the Key Performance Indicators (KPIs) on them.

dashboard software, social community dashboard, dashboard facebook ConceptDraw Dashboard for Facebook

dashboard software, social community dashboard, dashboard facebook
ConceptDraw Dashboard for Facebook solution extends ConceptDraw DIAGRAM software with a dynamically updated visual dashboard, which shows lifetime total likes, daily friends of fans, and daily page views, information you can receive from Facebook Insights.

sales dashboard, sales metrics Sales Dashboard

sales dashboard, sales metrics
Sales Dashboard solution extends ConceptDraw DIAGRAM software with templates, samples and library of vector stencils for drawing the visual dashboards of sale metrics and key performance indicators (KPI).

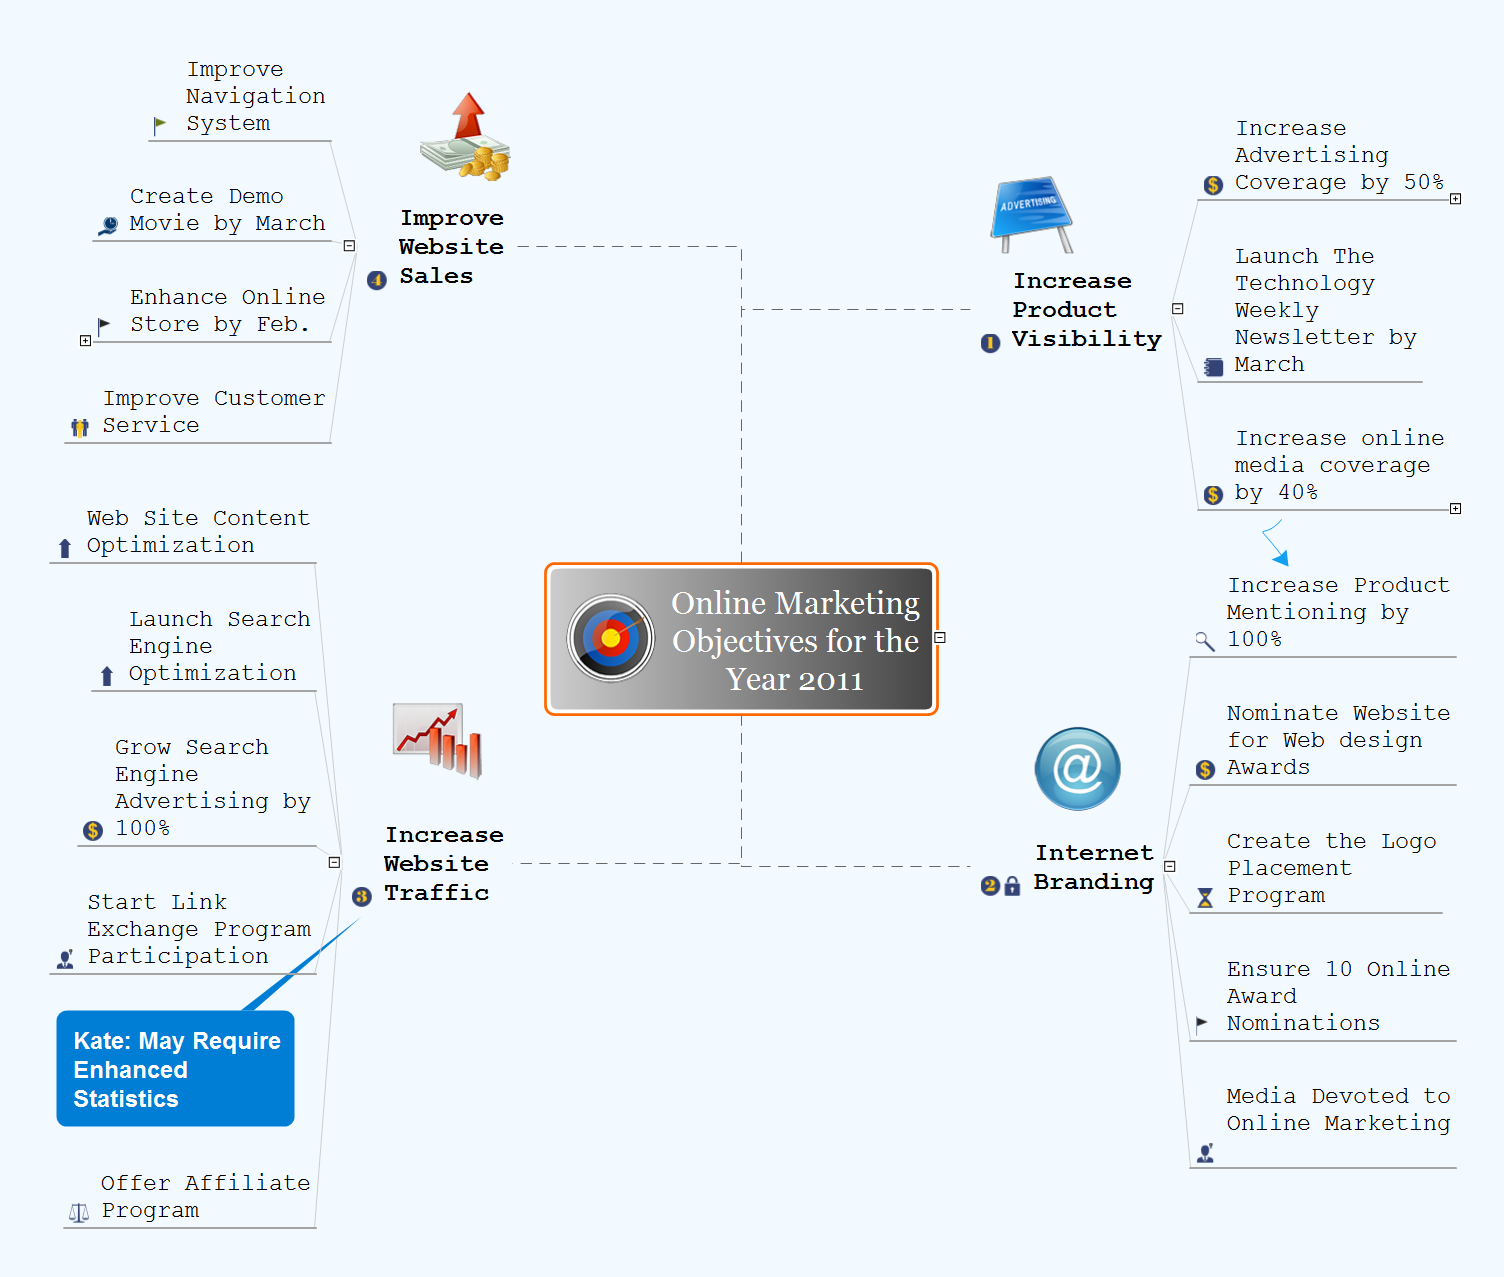
Online Marketing Objectives

Mind map specifying various online marketing objectives for a company with specific targets outlined for each objective.

Gant Chart in Project Management

Gant Chart is a graphical representation of tasks as segments on a time scale. It helps plan and monitor project development or resource allocation. The horizontal axis is a time scale, expressed either in absolute or relative time.
what is software project management

Gantt chart examples

All Gantt charts were made using ConceptDraw PROJECT. ConceptDraw PROJECT works both on Windows and Mac OS X. It allows to schedule a voluntary number of projects in a single Workspace document and lets easily share tasks and resources among them. ConceptDraw PROJECT shares files among Windows and Mac OS X.

SWOT Analysis

The SWOT Analysis provides information that is helpful in matching the firm's resources and capabilities to the competitive environment in which it operates. As such, it is instrument in strategy formulation and selection. SWOT analysis is a method of strategic planning which identifies the factors internal and external environment of the firm and divides them into 4 categories: strengths, weaknesses, opportunities and threats. The ConceptDraw DIAGRAM and MINDMAP software allow professional to make well-designed SWOT matrix in minutes.

social media flow chart, social media marketing Social Media Response

social media flow chart, social media marketing
This solution extends ConceptDraw DIAGRAM and ConceptDraw MINDMAP with the ability to draw interactive flow charts with action mind map templates, to help create an effective response to applicable social media mentions.

How to Create a Social Media DFD Flowchart

Interactive tool helps you create a social media DFD flowchart to find the appropriate response to social media mentions quickly.
It allows companies to be more effective in timely messaging thanks to the ability for rapid response to a customer′s post in social media. This saves budget for companies who use social media for promoting and as a lead generation tool.

BPMN standard, Business Process Diagram, BPMN, Business Process Business Process Diagrams

BPMN standard, Business Process Diagram, BPMN, Business Process
Business Process Diagrams solution extends the ConceptDraw DIAGRAM BPM software with RapidDraw interface, templates, samples and numerous libraries based on the BPMN 1.2 and BPMN 2.0 standards, which give you the possibility to visualize equally easy simple and complex processes, to design business models, to quickly develop and document in details any business processes on the stages of project’s planning and implementation.

Examples of Flowcharts, Org Charts and More

ConceptDraw examples covers a broad spectrum of business graphics categories. We separated all the graphic documents on application areas and had produced multiple solutions for each of them. ConceptDraw provides a wide variety of examples such as flowcharts, organizational charts, business charts, UML diagrams, database and ERD, directional map, network diagrams and lots more. Each solution accommodates 10+ examples that shows specific application cases of a diagram. ConceptDraw STORE is an application for downloading solutions with examples, templates and stencil libraries. Please choose any examples you are interested in, alternatively download them for free; you will need to install ConceptDraw to view them. As you will see, ConceptDraw is very powerful, you can use more than 10000 symbols, examples, and many pre-drawn templates, to create your own spectacular flowcharts, business diagrams, network diagrams and lots more, effortlessly, and in no time at all.
What is ConceptDraw OFFICE

Ansoff Matrix

ConceptDraw DIAGRAM software extended with Matrices Solution from the Marketing Area of ConceptDraw Solution Park offers you the possibility to develop the Ansoff Matrix of any complexity.

Tweet, twitter, mindmap, mind map, mindmapping tools, sending of Tweets, Effective Message with Twitter, solution park MindTweet

Tweet, twitter, mindmap, mind map, mindmapping tools, sending of Tweets, Effective Message with Twitter, solution park
This solution extends ConceptDraw MINDMAP software with the ability to brainstorm, review and organize the sending of Tweets.