The vector stencils library "Status indicators" contains 41 visual status indicators. Each status indicator can visualize one of 2-6 information states and have a caption.
Use it to create your business performance dashboards in the ConceptDraw PRO diagramming and vector drawing software extended with the Status Dashboard solution from the area "What is a Dashboard" of ConceptDraw Solution Park.
Use it to create your business performance dashboards in the ConceptDraw PRO diagramming and vector drawing software extended with the Status Dashboard solution from the area "What is a Dashboard" of ConceptDraw Solution Park.
2-State Alert, Red

2-State Alert, Yellow

2-State Alert, Green

2-State Alert, Blue

3-State Alert 1

3-State Alert 2

4-State Alert 1

4-State Alert 2

5-State Alert 1

5-State Alert 2

Forth-Back 1

Forth-Back 2

Back-Forth 1

Back-Forth 2

Up-Down 1

Up-Down 2

Down-Up 1

Down-Up 2

Arrows Up-Down 1

Arrows Up-Down 2

Arrows Down-Up 1

Arrows Down-Up 2

Traffic Light Vertical 1

Traffic Light Vertical 2

Traffic Light Horizontal 1

Traffic Light Horizontal 2

Progress Lights, Green

Progress Lights, Yellow

Progress Lights, Red

5-Stars Rating

Progress Bar, Blue

Progress Bar, Green

Progress Bar, Yellow

Progress Bar, Red

Access

Quality

Switch

Speed

Light Emitting

Shapes Alert 1

Shapes Alert 2

 Composition Dashboard
Composition dashboard solution extends ConceptDraw PRO software with templates, samples and vector stencils library with charts and indicators for drawing visual dashboards showing data composition.
 Status Dashboard
Status dashboard solution extends ConceptDraw PRO software with templates, samples and vector stencils libraries with graphic indicators for drawing the visual dashboards showing status data.
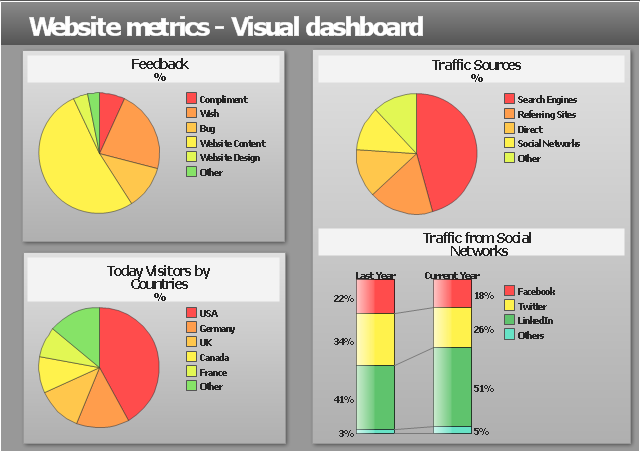
"Web analytics is the measurement, collection, analysis and reporting of internet data for purposes of understanding and optimizing web usage.
Web analytics is not just a tool for measuring web traffic but can be used as a tool for business and market research, and to assess and improve the effectiveness of a web site. Web analytics applications can also help companies measure the results of traditional print or broadcast advertising campaigns. It helps one to estimate how traffic to a website changes after the launch of a new advertising campaign. Web analytics provides information about the number of visitors to a website and the number of page views. It helps gauge traffic and popularity trends which is useful for market research.
There are two categories of web analytics; off-site and on-site web analytics.
Off-site web analytics refers to web measurement and analysis regardless of whether you own or maintain a website.
On-site web analytics measure a visitor's behavior once on your website. This includes its drivers and conversions; for example, the degree to which different landing pages are associated with online purchases. On-site web analytics measures the performance of your website in a commercial context. This data is typically compared against key performance indicators for performance, and used to improve a web site or marketing campaign's audience response." [Web analytics. Wikipedia]
The example "Website metrics - Visual dashboard" was created using the ConceptDraw PRO diagramming and vector drawing software extended with the Composition Dashboard solution from the area "What is a Dashboard" of ConceptDraw Solution Park.
Visual dashboard
The vector stencils library "Meter indicators" contains 29 Live Objects: speedometer gauge, dial, bullet graph, slider and level meter visual indicators.
The Live Objects designed to display actual measures of performance metrics and KPIs from external data source files.
Some of them also display comparative measures, and colored zones of qualitative ranges with legend.
Use it to draw business performance dashboards using the ConceptDraw PRO diagramming and vector drawing software .
"Digital dashboards may be laid out to track the flows inherent in the business processes that they monitor. Graphically, users may see the high-level processes and then drill down into low level data. This level of detail is often buried deep within the corporate enterprise and otherwise unavailable to the senior executives. ...
Specialized dashboards may track all corporate functions. Examples include human resources, recruiting, sales, operations, security, information technology, project management, customer relationship management and many more departmental dashboards. ...
Like a car's dashboard (or control panel), a software dashboard provides decision makers with the input necessary to "drive" the business. Thus, a graphical user interface may be designed to display summaries, graphics (e.g., bar charts, pie charts, bullet graphs, "sparklines," etc.), and gauges (with colors similar to traffic lights) in a portal-like framework to highlight important information. ...
Digital dashboards allow managers to monitor the contribution of the various departments in their organization. To gauge exactly how well an organization is performing overall, digital dashboards allow you to capture and report specific data points from each department within the organization, thus providing a "snapshot" of performance." [Dashboard (management information systems). Wikipedia]
The example "Design elements - Meter indicators" is included in the Meter Dashboard solution from the area "What is a Dashboard" of ConceptDraw Solution Park.
Visual indicators

 Time Series Dashboard
Time series dashboard solution extends ConceptDraw PRO software with templates, samples and vector stencils libraries with charts, graphs and plots for drawing the visual dashboards showing data time series.
HelpDesk
How to Connect a Live Object to a Text Data Source


 Wireless Networks
The Wireless Networks Solution extends ConceptDraw PRO software with professional diagramming tools to help network engineers and designers efficiently design and create wireless network diagrams that illustrate wireless networks of any speed and complexity.
 Azure Architecture
Create Microsoft Azure architecture diagrams using icons and templates regarding Azure management, Azure storage and Azure services.
 Stakeholder Onion Diagrams
The Stakeholder Onion Diagram is often used as a way to view the relationships of stakeholders to a project goal. A basic Onion Diagram contains a rich information. It shows significance of stakeholders that will have has influence to the success achieve
- Performance Indicators | Georgia DOT performance management ...
- Website traffic dashboard | Website metrics - Visual dashboard ...
- KPIs and Metrics | Sales metrics and KPIs - Visual dashboard | Meter ...
- Website traffic dashboard | Website metrics - Visual dashboard ...
- Website metrics - Visual dashboard
- Traffic Condition Dashboard
- Status Dashboard | Road Transport - Design Elements | Aerospace ...
- Marketing Campaign Performance Dashboard Examples
- Website traffic dashboard | Website metrics - Visual dashboard | Star ...
- Correlation Dashboard | Website traffic dashboard | Business ...
- Schmatic On Digital Security Traffic Light
- KPIs and Metrics | Business Intelligence Dashboard | Website ...
- Design elements - Meter indicators | Meter indicators 2 - Vector ...
- Financial Performance Dashboard
- Meter Dashboard | Georgia DOT performance management - Meter ...
- Traffic Likes
- Website traffic dashboard | Composition Dashboard | Data ...
- Status Dashboard | TQM Diagram — Professional Total Quality ...
- Five Dashboard Indicator
- Cafe performance metrics vs. air temperature - Visual dashboard ...