This example was created on the base of the Georgia DOT Performance Management Dashboard from the Georgia Department of Transportation website.
[dot.ga.gov/ informationcenter/ statistics/ performance/ Pages/ default.aspx]
"Performance management (PM) includes activities which ensure that goals are consistently being met in an effective and efficient manner. Performance management can focus on the performance of an organization, a department, employee, or even the processes to build a product of service, as well as many other areas.
PM is also known as a process by which organizations align their resources, systems and employees to strategic objectives and priorities.
Performance management originated as a broad term coined by Dr. Aubrey Daniels in the late 1970s to describe a technology (i.e. science imbedded in applications methods) for managing both behavior and results, two critical elements of what is known as performance. A formal definition of performance management, according to Daniels' is "a scientifically based, data-oriented management system. It consists of three primary elements-measurement, feedback and positive reinforcement."" [Performance management. Wikipedia]
The meter dashboard example "Georgia DOT Performance Management" was created using the ConceptDraw PRO diagramming and vector drawing software extended with the Meter Dashboard solution from the area "What is a Dashboard" of ConceptDraw Solution Park.
Meter dashboard

Performance Indicators

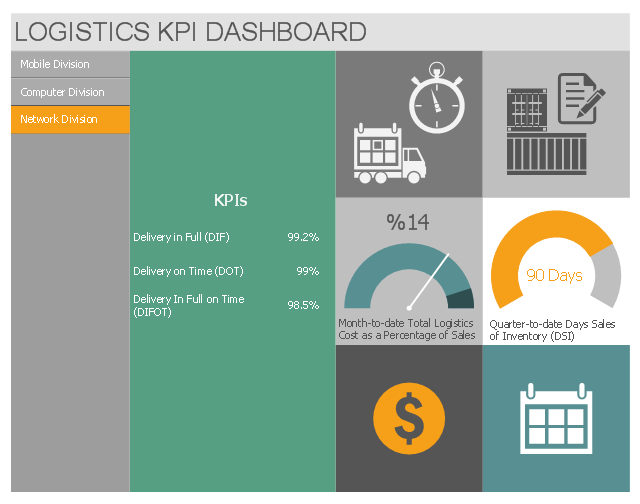
This multipage business dashboard example shows navigation vertical menu and graphic indicators of logistic key performance indicators (KPIs) and business metrics.
"A performance indicator or key performance indicator (KPI) is a type of performance measurement. KPIs evaluate the success of an organization or of a particular activity in which it engages. Often success is simply the repeated, periodic achievement of some levels of operational goal..., and sometimes success is defined in terms of making progress toward strategic goals. Accordingly, choosing the right KPIs relies upon a good understanding of what is important to the organization." [Performance indicator. Wikipedia]
The performance dashboard example "Logistics KPI Dashboard" was designed using ConceptDraw PRO software extended with Logistic Dashboard solution from Business Processes area of ConceptDraw Solution Park.
Mobile Division
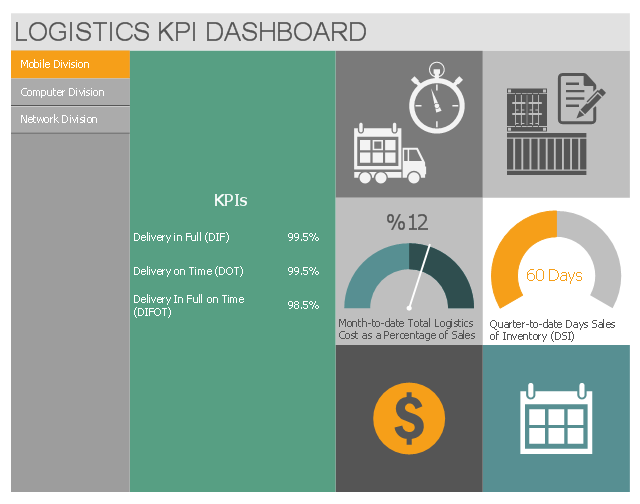
Computer Division
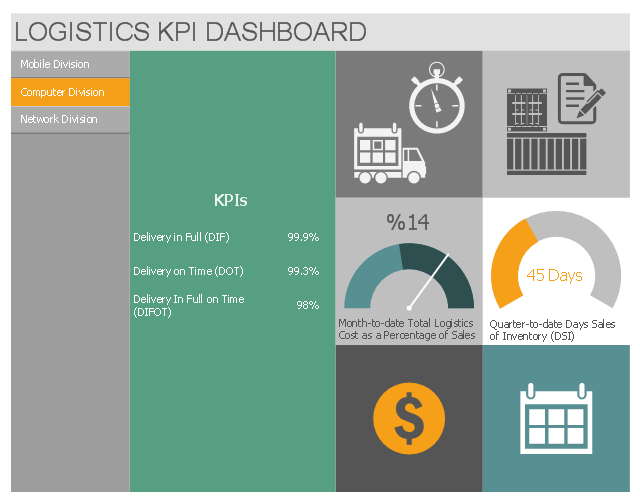
Network Division
"A performance indicator or key performance indicator (KPI) is a type of performance measurement. An organization may use KPIs to evaluate its success, or to evaluate the success of a particular activity in which it is engaged. Sometimes success is defined in terms of making progress toward strategic goals, but often success is simply the repeated, periodic achievement of some level of operational goal (e.g. zero defects, 10/ 10 customer satisfaction, etc.). Accordingly, choosing the right KPIs relies upon a good understanding of what is important to the organization. 'What is important' often depends on the department measuring the performance - e.g. the KPIs useful to finance will be quite different from the KPIs assigned to sales. Since there is a need to understand well what is important (to an organization), various techniques to assess the present state of the business, and its key activities, are associated with the selection of performance indicators. These assessments often lead to the identification of potential improvements, so performance indicators are routinely associated with 'performance improvement' initiatives." [Performance indicator. Wikipedia]
The example "Website KPIs - Visual dashboard" was created using the ConceptDraw PRO diagramming and vector drawing software extended with the Composition Dashboard solution from the area "What is a Dashboard" of ConceptDraw Solution Park.
The example "Website KPIs - Visual dashboard" was created using the ConceptDraw PRO diagramming and vector drawing software extended with the Composition Dashboard solution from the area "What is a Dashboard" of ConceptDraw Solution Park.
Visual dashboard

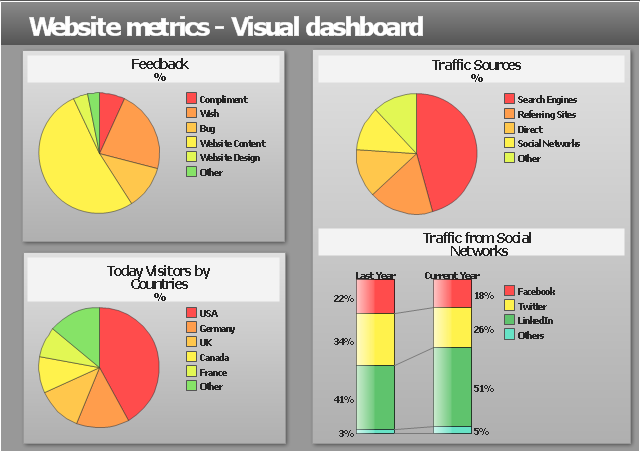
"Web analytics is the measurement, collection, analysis and reporting of internet data for purposes of understanding and optimizing web usage.
Web analytics is not just a tool for measuring web traffic but can be used as a tool for business and market research, and to assess and improve the effectiveness of a web site. Web analytics applications can also help companies measure the results of traditional print or broadcast advertising campaigns. It helps one to estimate how traffic to a website changes after the launch of a new advertising campaign. Web analytics provides information about the number of visitors to a website and the number of page views. It helps gauge traffic and popularity trends which is useful for market research.
There are two categories of web analytics; off-site and on-site web analytics.
Off-site web analytics refers to web measurement and analysis regardless of whether you own or maintain a website.
On-site web analytics measure a visitor's behavior once on your website. This includes its drivers and conversions; for example, the degree to which different landing pages are associated with online purchases. On-site web analytics measures the performance of your website in a commercial context. This data is typically compared against key performance indicators for performance, and used to improve a web site or marketing campaign's audience response." [Web analytics. Wikipedia]
The example "Website metrics - Visual dashboard" was created using the ConceptDraw PRO diagramming and vector drawing software extended with the Composition Dashboard solution from the area "What is a Dashboard" of ConceptDraw Solution Park.
Visual dashboard
 Matrices
This solution extends ConceptDraw DIAGRAM software with samples, templates and library of design elements for drawing the business matrix diagrams.
 HR Dashboard
The HR Dashboard solution extends ConceptDraw DIAGRAM functionality with powerful drawing tools and great collection of comprehensive vector design elements, icons, pictograms and objects, navigation elements, live objects of HR charts, HR indicators, and thematic maps. The range of HR Dashboards applications is extensive, among them the human resource management, recruitment, hiring process, human resource development. ConceptDraw DIAGRAM software is perfect for creation HR Dashboard with any goal you need. It gives you all opportunities for designing not only informative, but also professional looking and attractive HR Dashboards of any style and degree of detalization, that are perfect for using in presentations, reports and other thematic documents.
 Sales Dashboard
Sales Dashboard solution extends ConceptDraw DIAGRAM software with templates, samples and library of vector stencils for drawing the visual dashboards of sale metrics and key performance indicators (KPI).
- How to Change Measurement Units in ConceptDraw Drawing ...
- KPI Dashboard | Performance Indicators | Sales Dashboard | Key ...
- Performance Indicators | KPI Dashboard | Constant improvement of ...
- Logistics Performance Dashboard - Template | Sales KPIs ...
- ConceptDraw PRO 11 Update Released
- Ice Hockey Rink Dimensions | Georgia DOT performance ...
- Georgia DOT performance management - Meter dashboard ...
- ConceptDraw | Press Releases
- Key Performance Indicators Icon
- Performance Indicators | Design elements - Sales KPIs and metrics ...