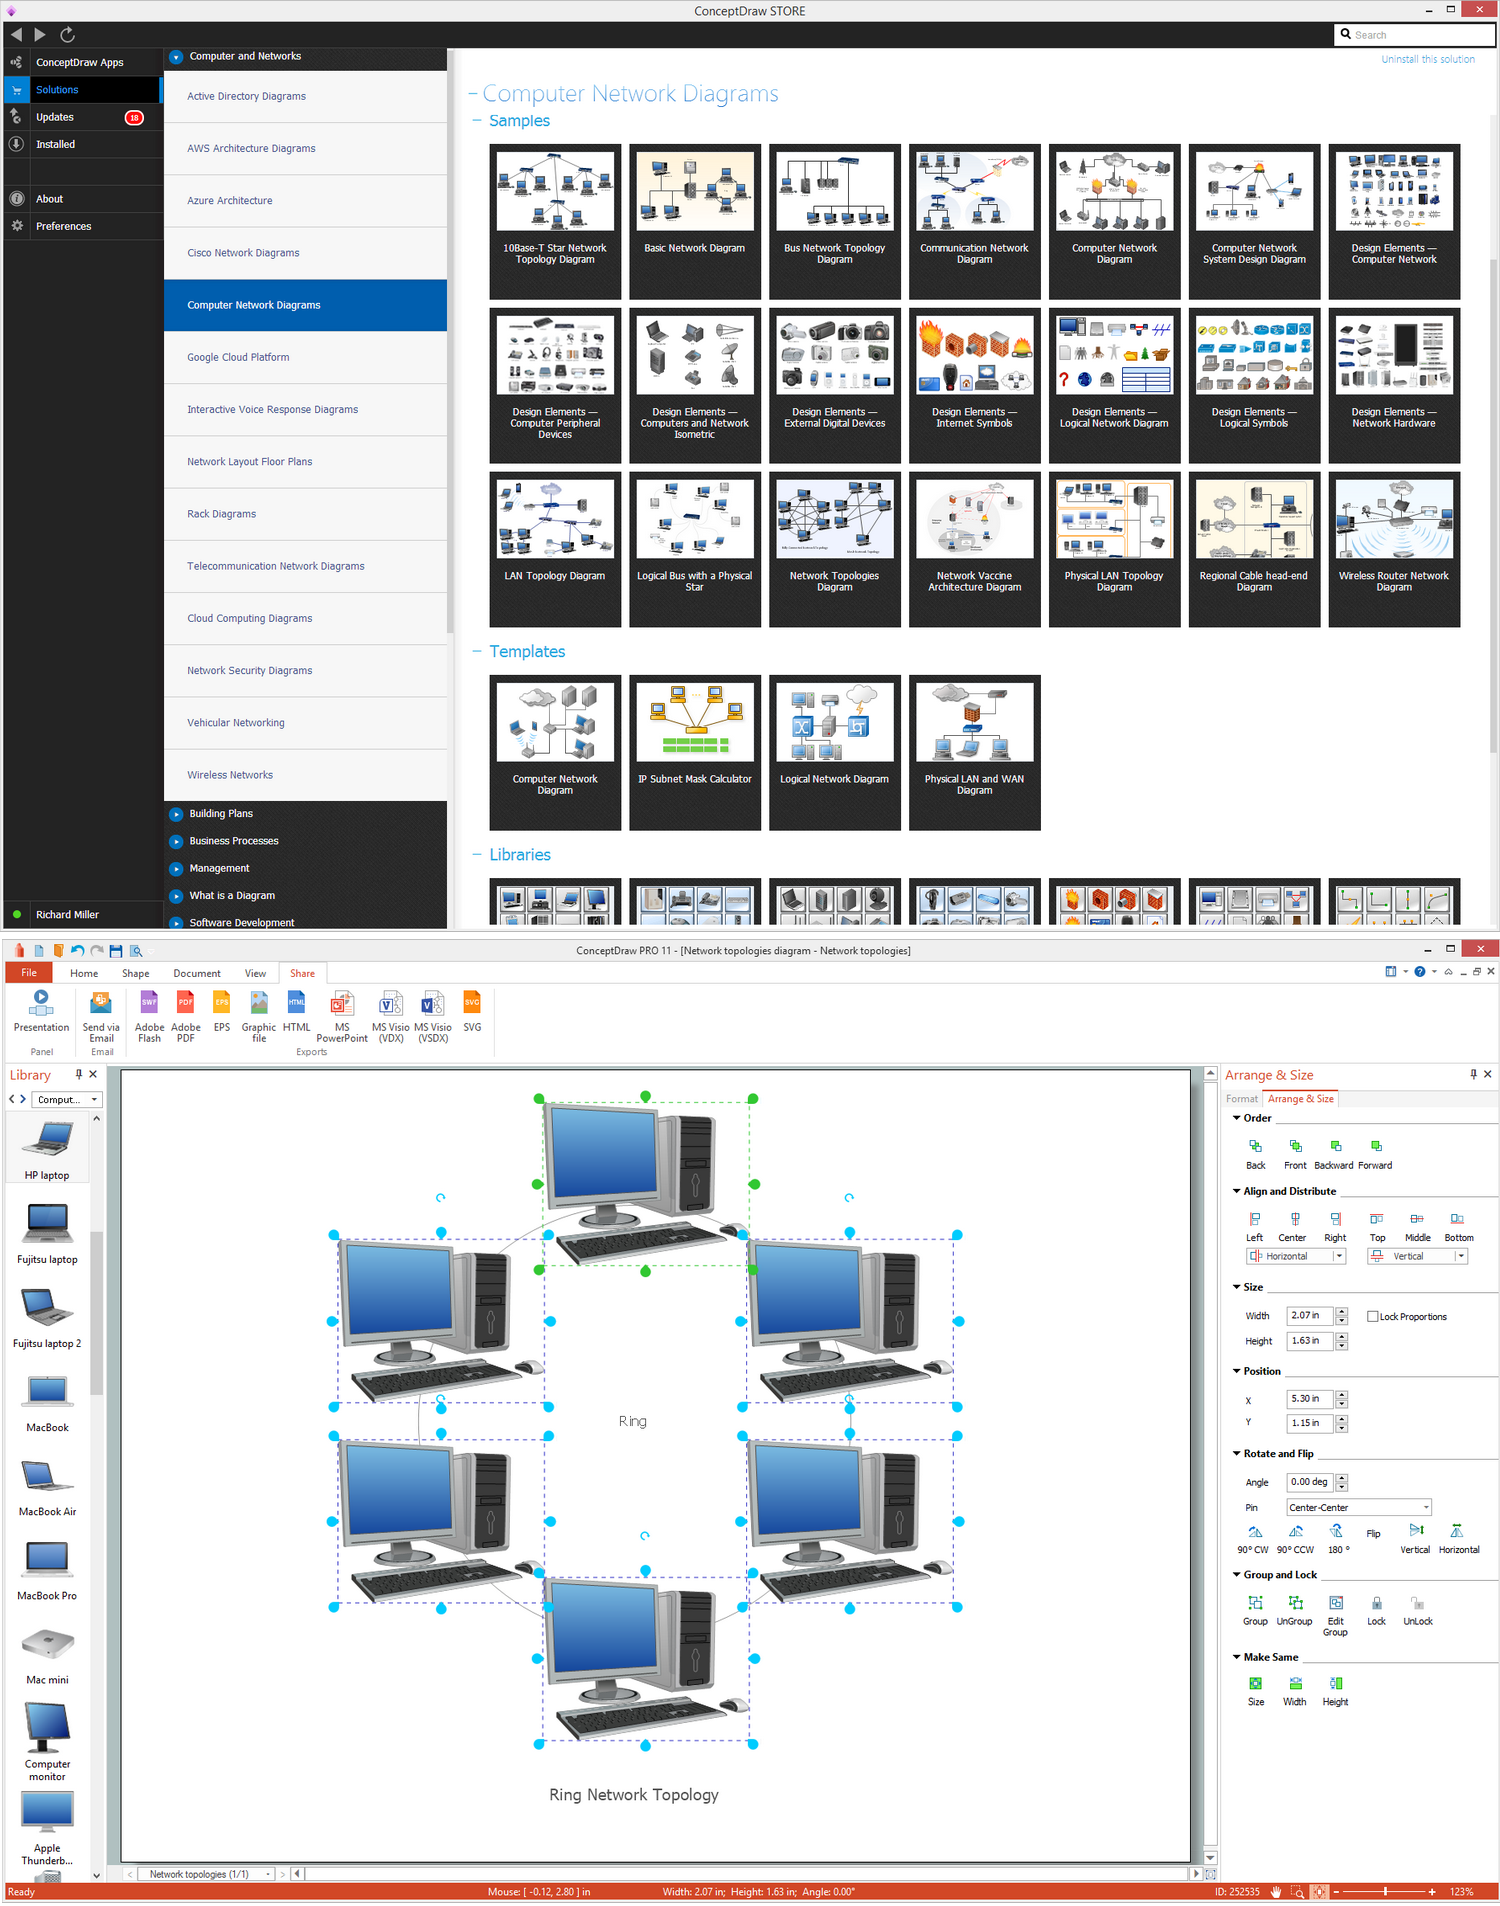
Ring Network Topology
The vector stencils library "Meter indicators" contains 29 Live Objects: speedometer gauge, dial, bullet graph, slider and level meter visual indicators.
The Live Objects designed to display actual measures of performance metrics and KPIs from external data source files.
Some of them also display comparative measures, and colored zones of qualitative ranges with legend.
Use it to draw business performance dashboards using the ConceptDraw PRO diagramming and vector drawing software .
"Digital dashboards may be laid out to track the flows inherent in the business processes that they monitor. Graphically, users may see the high-level processes and then drill down into low level data. This level of detail is often buried deep within the corporate enterprise and otherwise unavailable to the senior executives. ...
Specialized dashboards may track all corporate functions. Examples include human resources, recruiting, sales, operations, security, information technology, project management, customer relationship management and many more departmental dashboards. ...
Like a car's dashboard (or control panel), a software dashboard provides decision makers with the input necessary to "drive" the business. Thus, a graphical user interface may be designed to display summaries, graphics (e.g., bar charts, pie charts, bullet graphs, "sparklines," etc.), and gauges (with colors similar to traffic lights) in a portal-like framework to highlight important information. ...
Digital dashboards allow managers to monitor the contribution of the various departments in their organization. To gauge exactly how well an organization is performing overall, digital dashboards allow you to capture and report specific data points from each department within the organization, thus providing a "snapshot" of performance." [Dashboard (management information systems). Wikipedia]
The example "Design elements - Meter indicators" is included in the Meter Dashboard solution from the area "What is a Dashboard" of ConceptDraw Solution Park.
Visual indicators

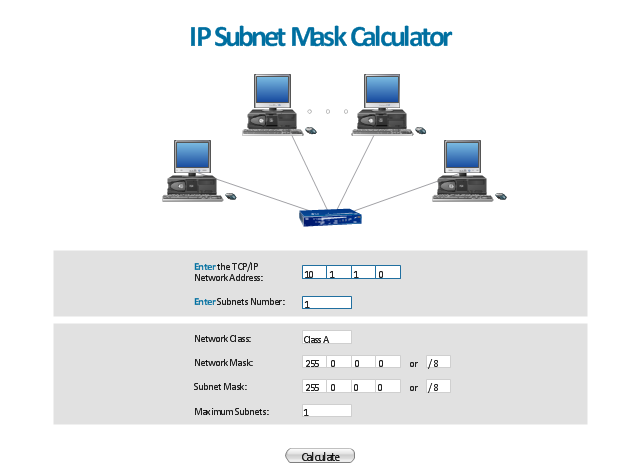
"A subnetwork, or subnet, is a logically visible subdivision of an IP network. The practice of dividing a network into two or more networks is called subnetting.
All computers that belong to a subnet are addressed with a common, identical, most-significant bit-group in their IP address. This results in the logical division of an IP address into two fields, a network or routing prefix and the rest field or host identifier. The rest field is an identifier for a specific host or network interface.
The routing prefix is expressed in CIDR notation. It is written as the first address of a network, followed by a slash character (/ ), and ending with the bit-length of the prefix. ...
The IPv6 address specification 2001:db8::/ 32 is a large address block with 296 addresses, having a 32-bit routing prefix. In IPv4 the routing prefix is also specified in the form of the subnet mask, which is expressed in quad-dotted decimal representation like an address. ...
Traffic between subnetworks is exchanged or routed with special gateways called routers which constitute the logical or physical boundaries between the subnets.
The benefits of subnetting vary with each deployment scenario. In the address allocation architecture of the Internet using Classless Inter-Domain Routing (CIDR) and in large organizations, it is necessary to allocate address space efficiently. It may also enhance routing efficiency, or have advantages in network management when subnetworks are administratively controlled by different entities in a larger organization. Subnets may be arranged logically in a hierarchical architecture, partitioning an organization's network address space into a tree-like routing structure." [Subnetwork. Wikipedia]
The template "IP Subnet mask calculator" for the ConceptDraw PRO diagramming and vector drawing software is included in the Computer and Networks solution from the Computer and Networks area of ConceptDraw Solution Park.
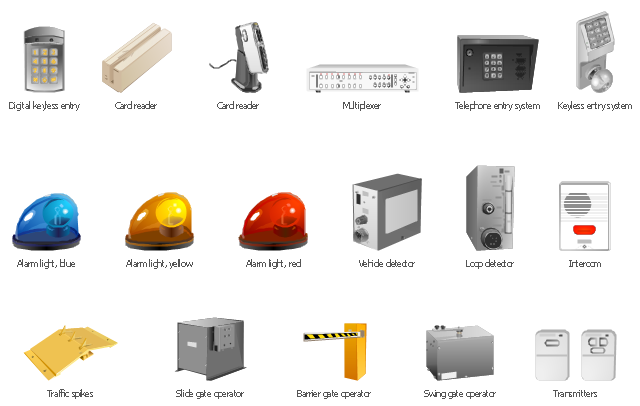
The vector clipart library Access and security contains 17 images of access control and security system equipment.
"In the fields of physical security and information security, access control is the selective restriction of access to a place or other resource. The act of accessing may mean consuming, entering, or using. Permission to access a resource is called authorization.
Locks and login credentials are two analogous mechanisms of access control. ...
The term access control refers to the practice of restricting entrance to a property, a building, or a room to authorized persons. Physical access control can be achieved by a human (a guard, bouncer, or receptionist), through mechanical means such as locks and keys, or through technological means such as access control systems like the mantrap. Within these environments, physical key management may also be employed as a means of further managing and monitoring access to mechanically keyed areas or access to certain small assets." [Access control. Wikipedia]
Use the vector stencils library Access and security to draw illustrations and diagrams of safety and security system equipment using the ConceptDraw PRO diagramming and vector drawing software.
The clipart example "Design elements - Access and security" is included in the Safety and Security solution from the Illustration area of ConceptDraw Solution Park.
Vector clip art
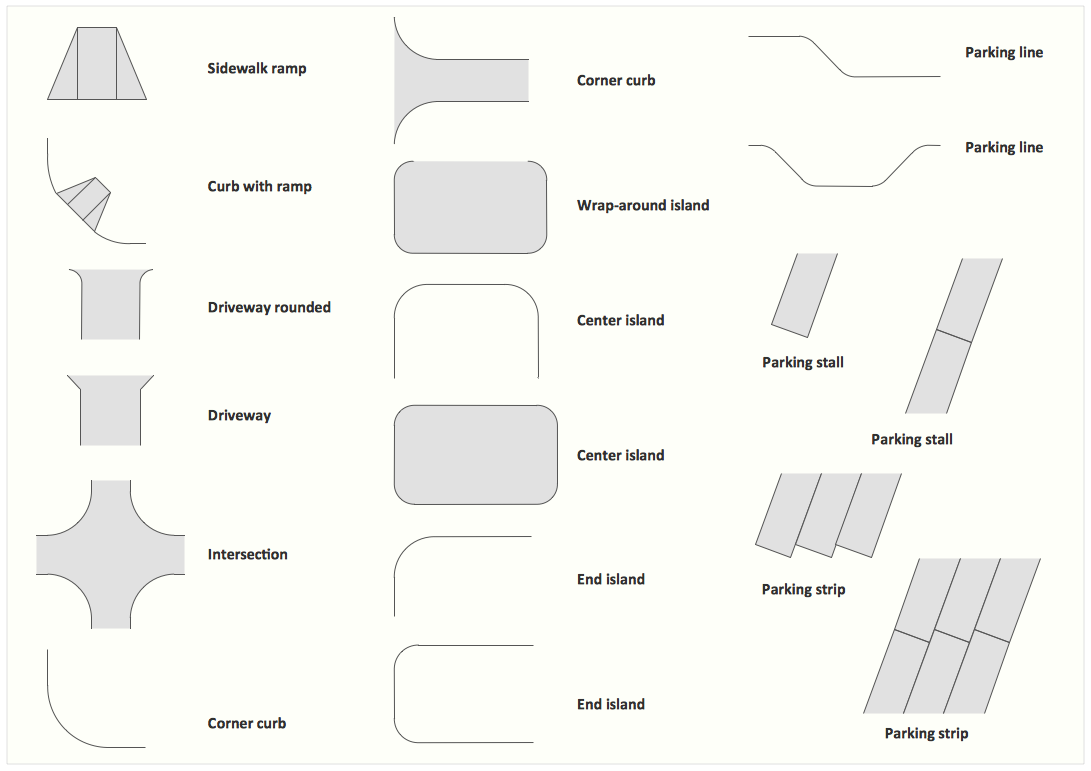
Road Transport - Design Elements
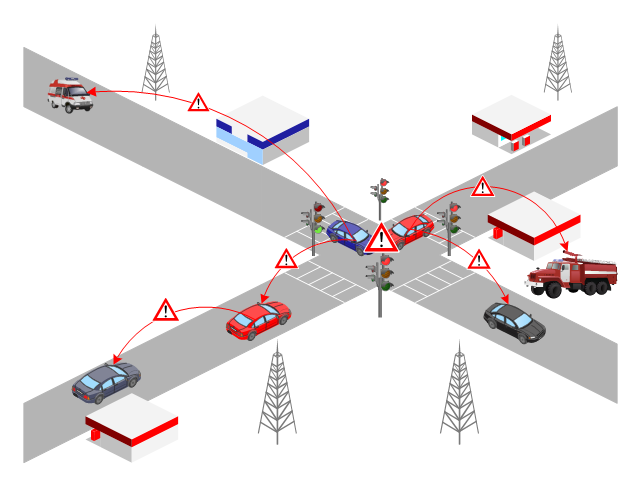
This VANET diagram example was drawn on the base of picture from the webpage "Security and Privacy in Location-based MANETs/ VANETs" from the Donald Bren School of Information and Computer Sciences, the University of California, Irvine. [ics.uci.edu/ ~keldefra/ manet.htm]
"A vehicular ad hoc network (VANET) uses cars as mobile nodes in a MANET to create a mobile network. A VANET turns every participating car into a wireless router or node, allowing cars approximately 100 to 300 metres of each other to connect and, in turn, create a network with a wide range. As cars fall out of the signal range and drop out of the network, other cars can join in, connecting vehicles to one another so that a mobile Internet is created. It is estimated that the first systems that will integrate this technology are police and fire vehicles to communicate with each other for safety purposes. Automotive companies like General Motors, Toyota, Nissan, DaimlerChrysler, BMW and Ford promote this term." [Vehicular ad hoc network. Wikipedia]
The VANET diagram example "Vehicular ad-hoc network" was created using the ConceptDraw PRO diagramming and vector drawing software extended with the Vehicular Networking solution from the Computer and Networks area of ConceptDraw Solution Park.
VANET diagram
Cisco Routers. Cisco icons, shapes, stencils and symbols

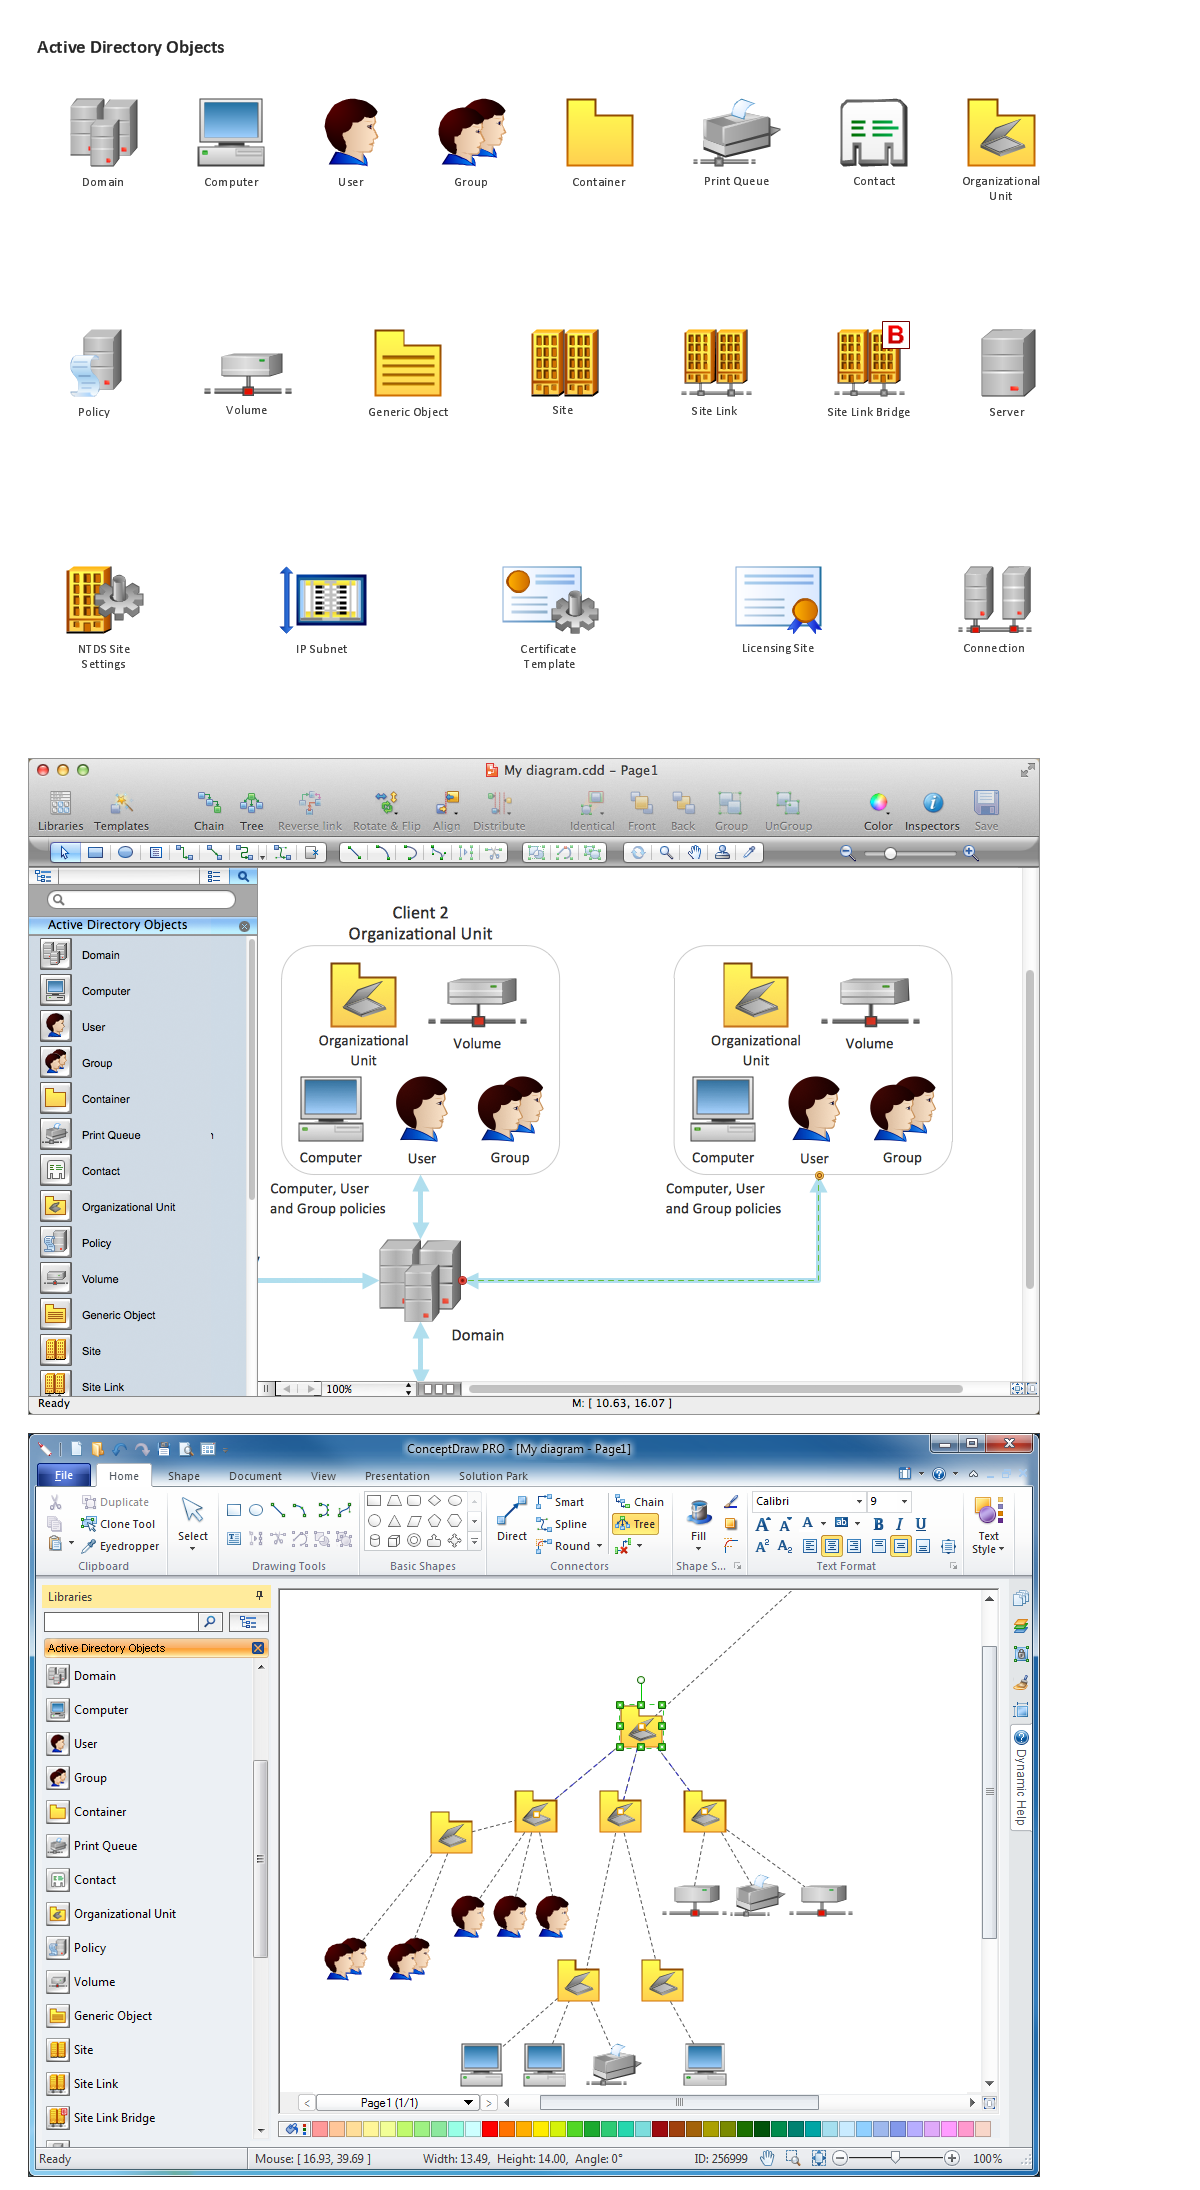
Active Directory Domain Services
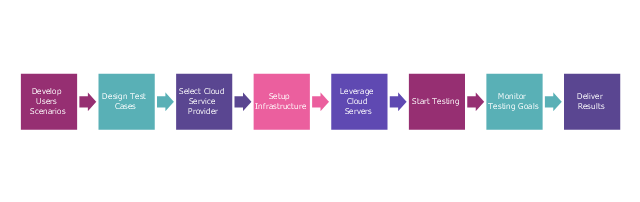
This step diagram example shows cloud testing steps. It was redesigned from the Wikimedia Commons file: Cloud Testing steps.png. [commons.wikimedia.org/ wiki/ File:Cloud_ Testing_ steps.png]
This file is licensed under the Creative Commons Attribution-Share Alike 3.0 Unported license. [creativecommons.org/ licenses/ by-sa/ 3.0/ deed.en]
"Cloud testing is a form of software testing in which web applications use cloud computing environments (a "cloud") to simulate real-world user traffic. ...
Cloud Testing uses cloud infrastructure for software testing. Organizations pursuing testing in general and load, performance testing and production service monitoring in particular are challenged by several problems like limited test budget, meeting deadlines, high costs per test, large number of test cases, and little or no reuse of tests and geographical distribution of users add to the challenges. Moreover ensuring high quality service delivery and avoiding outages requires testing in one's datacenter, outside the data-center, or both. Cloud Testing is the solution to all these problems. Effective unlimited storage, quick availability of the infrastructure with scalability, flexibility and availability of distributed testing environment reduce the execution time of testing of large applications and lead to cost-effective solutions." [Cloud testing. Wikipedia]
The step chart example "Cloud testing steps" was created using the ConceptDraw PRO diagramming and vector drawing software extended with the Marketing Diagrams solution from the Marketing area of ConceptDraw Solution Park.
Marketing diagram
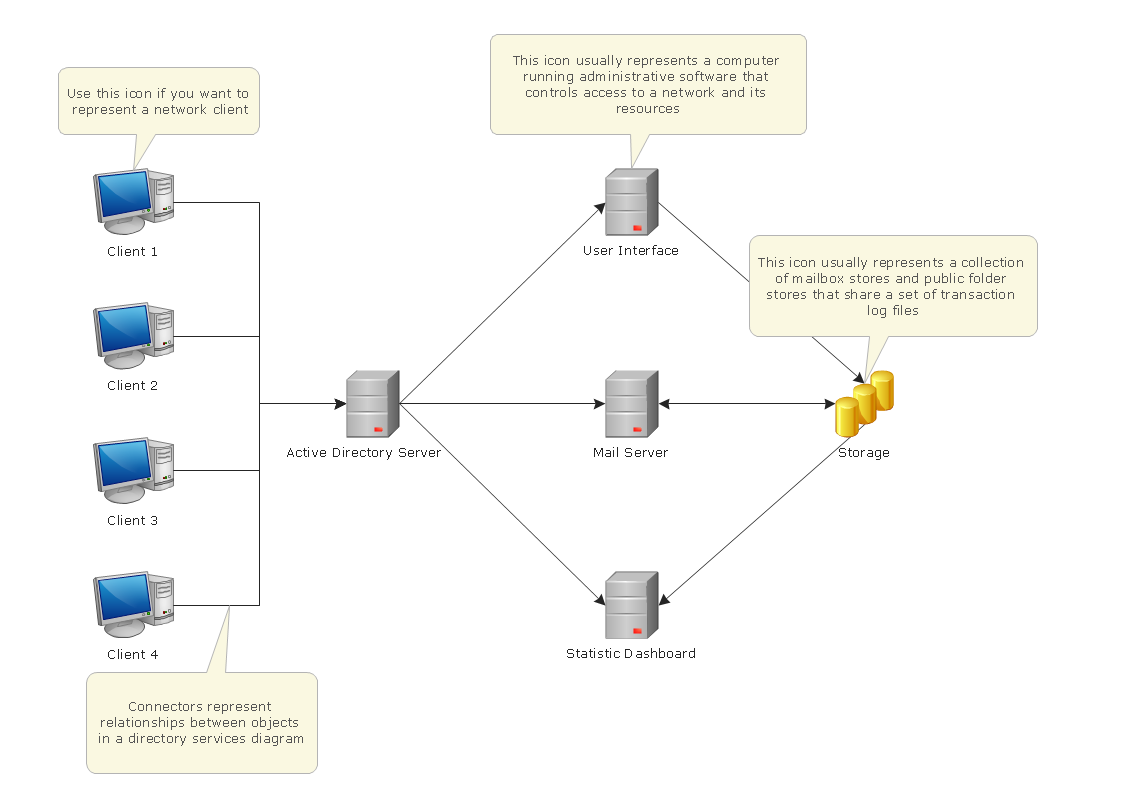
Network Diagramming Software for Network Active Directory Diagrams

Building Drawing. Design Element Site Plan
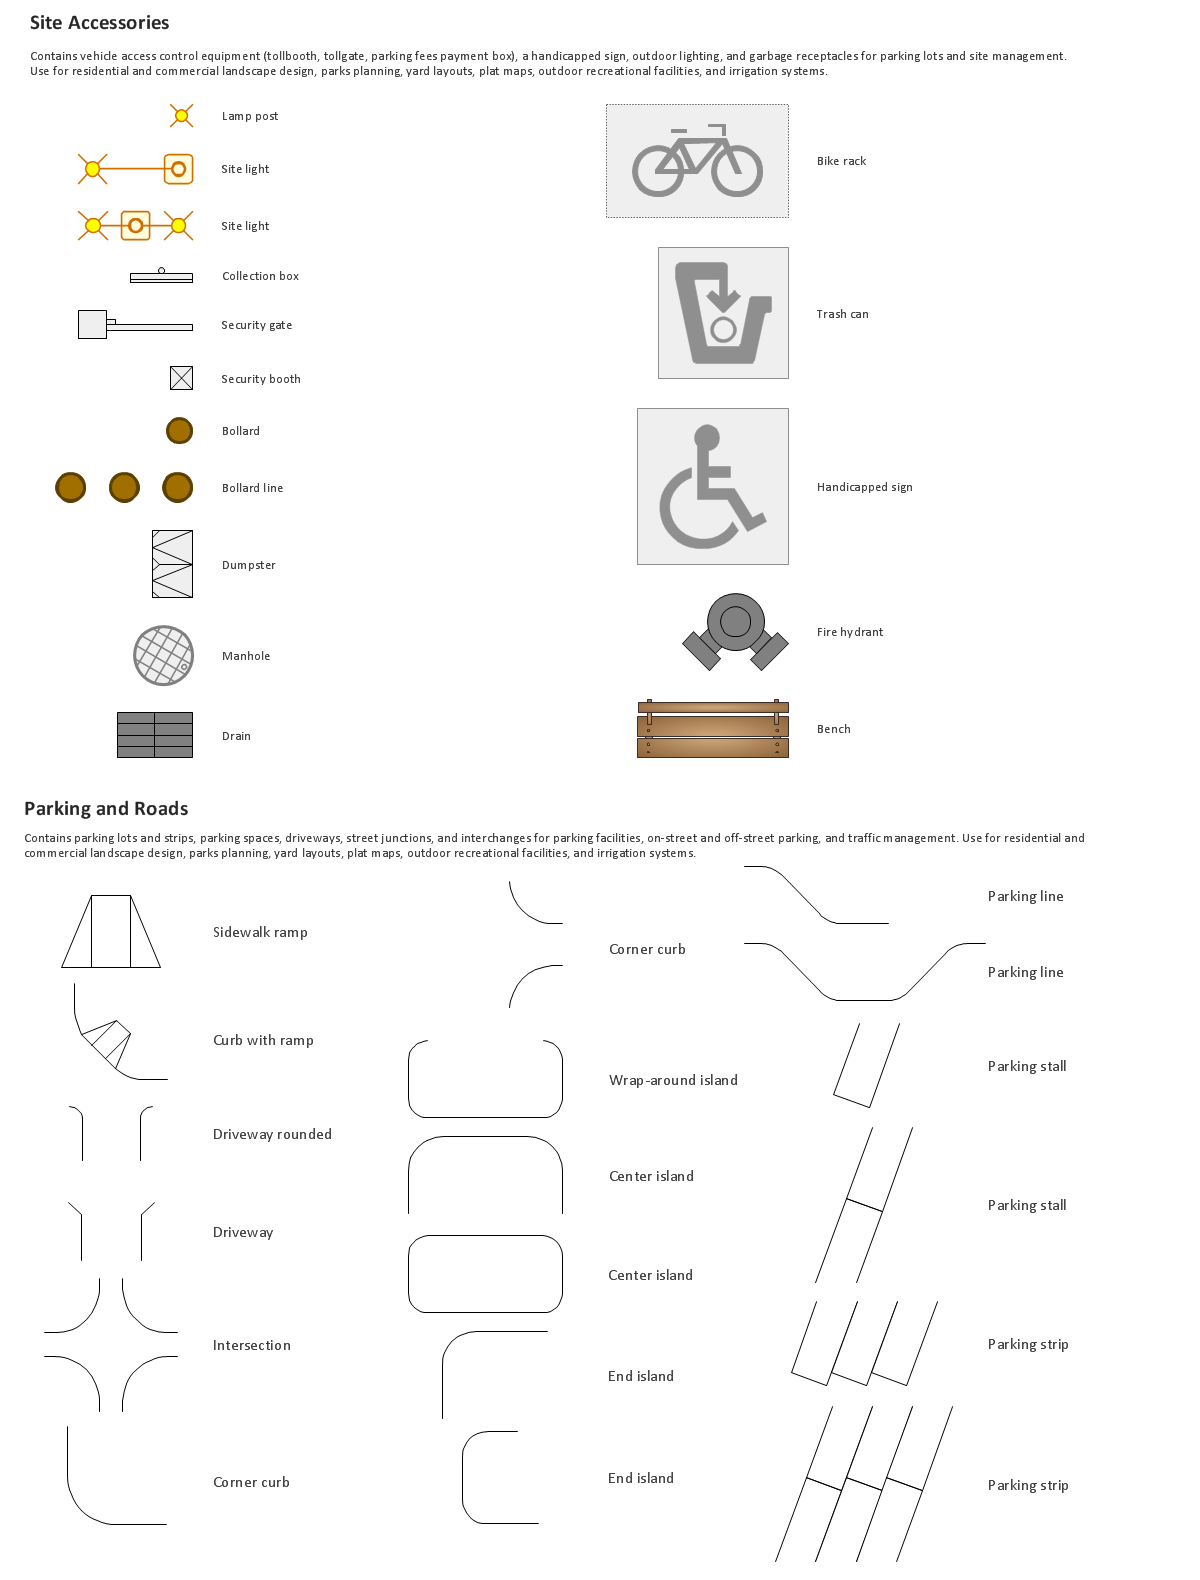

Interior Design. Site Plan — Design Elements
Virtual private networks (VPN). Computer and Network Examples

Computer Network Architecture. Computer and Network Examples
- Vehicular Networking | Drawings For Traffic Signal On The Roads At ...
- School Project On Traffic Signal
- Traffic Signal Diagrams
- How To Draw A Road Without Traffic Signal
- Some Symbols Of Traffic Signs
- Traffic Signal With Roads And Transport Drawing
- City Traffic Signal
- Access and security - Vector stencils library | Design elements ...
- Traffic And Communication Pictures
- Design elements - Road signs | Road Transport - Design Elements ...
- Symbols Of Traffic Signals
- Visio Stencil Traffic Signs
- Traffic Light On Road Drawing Map
- Status indicators - Vector stencils library | How to Connect Text Data ...
- Samples Of Traffic Signs
- 3D pictorial street map | Design elements - 3D directional maps ...
- Microsoft Visio Road Signs
- Website launch - Flowchart | Website Wireframe | Security system ...
- Entity-Relationship Diagram (ERD) with ConceptDraw PRO | UML ...