 Logistic Dashboard
The powerful tools of Logistic Dashboard solution and specially developed live graphic objects of logistic icons, logistic navigation elements, logistic indicators, logistic charts and logistic maps effectively assist in designing Logistic dashboards, Logistic maps, Logistic charts, diagrams and infographics. The included set of prebuilt samples and quick-start templates, demonstrates the power of ConceptDraw DIAGRAM software in logistics management, its assisting abilities in development, realization and analyzing the logistic processes, as well as in perfection the methods of logistics management.
 CRM Center Dashboard
The CRM Center Dashboard solution extends ConceptDraw DIAGRAM functionality with CRM software tools, large collection of CRM Charts live objects, CRM icons, CRM indicators, CRM maps and navigation elements, the set of professionally designed CRM samples and templates to help you construct your own CRM Dashboards and CRM Center Dashboards in a few minutes, to depict the current and actual data by connecting or refreshing the data source file. The customer management software ConceptDraw DIAGRAM makes you free to choose the style for your dashboard and to regulate the quantity of clipart on the diagram according to your taste.
 HR Dashboard
The HR Dashboard solution extends ConceptDraw DIAGRAM functionality with powerful drawing tools and great collection of comprehensive vector design elements, icons, pictograms and objects, navigation elements, live objects of HR charts, HR indicators, and thematic maps. The range of HR Dashboards applications is extensive, among them the human resource management, recruitment, hiring process, human resource development. ConceptDraw DIAGRAM software is perfect for creation HR Dashboard with any goal you need. It gives you all opportunities for designing not only informative, but also professional looking and attractive HR Dashboards of any style and degree of detalization, that are perfect for using in presentations, reports and other thematic documents.
 ConceptDraw Dashboard for Facebook
ConceptDraw Dashboard for Facebook solution extends ConceptDraw DIAGRAM software with a dynamically updated visual dashboard, which shows lifetime total likes, daily friends of fans, and daily page views, information you can receive from Facebook Insights.
Sales Dashboard
Sales KPI Dashboards
 House of Quality
House of Quality solution provides the powerful drawing tools, numerous specific samples and examples, and set of vector design elements of House of Quality shapes and symbols, which will help you in application the Quality function deployment (QFD) methodology and in easy creation the House of Quality Matrices intended for satisfaction the consumers' desires and requirements, for representing them in a visual way and then transformation into the targets and technical requirements to be followed for development the best products.
 Business Intelligence Dashboard
Business Intelligence Dashboard solution extends the ConceptDraw DIAGRAM functionality with exclusive tools, numerous ready-to-use vector objects, samples and quick-start templates for creation professional Business Intelligence Dashboards, Business Intelligence Graphics, Business Intelligence Charts and Maps of different kinds. Design easy the BI dashboard, BI model or Dynamic chart in ConceptDraw DIAGRAM to monitor the company's work, to track the indicators corresponding your company's data, to display and analyze key performance indicators, to evaluate the trends and regularities of the processes occurring at the company.
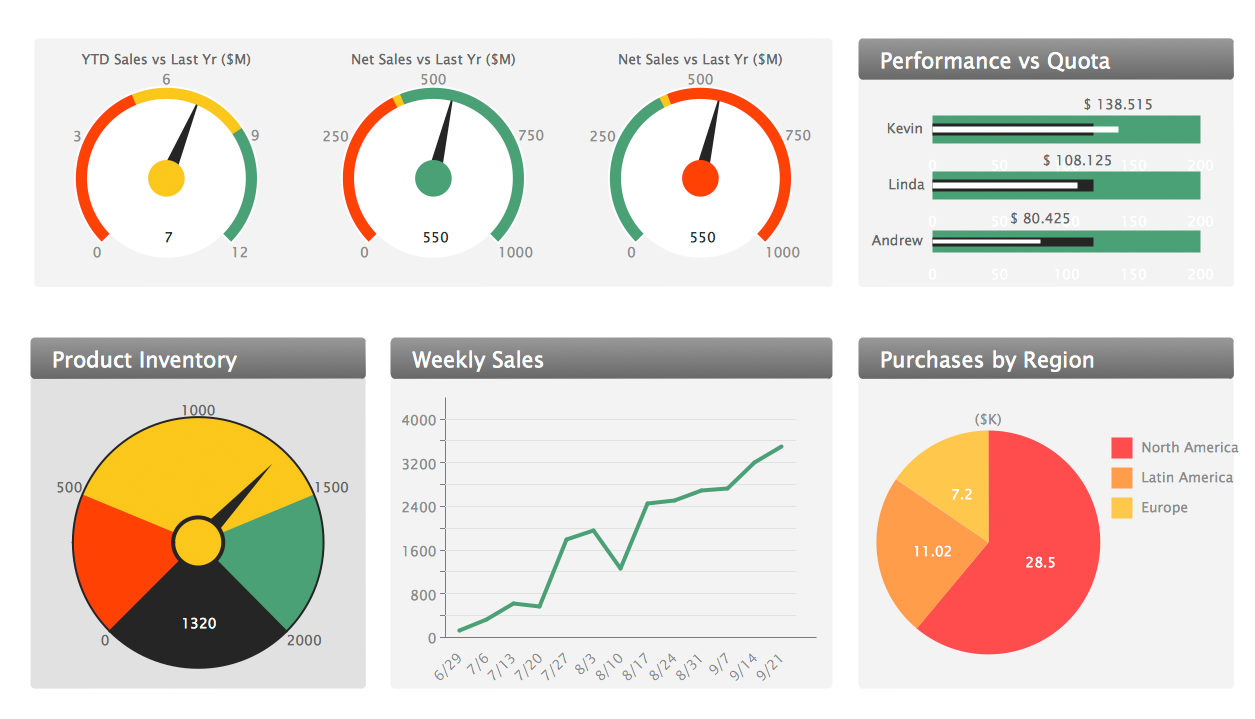
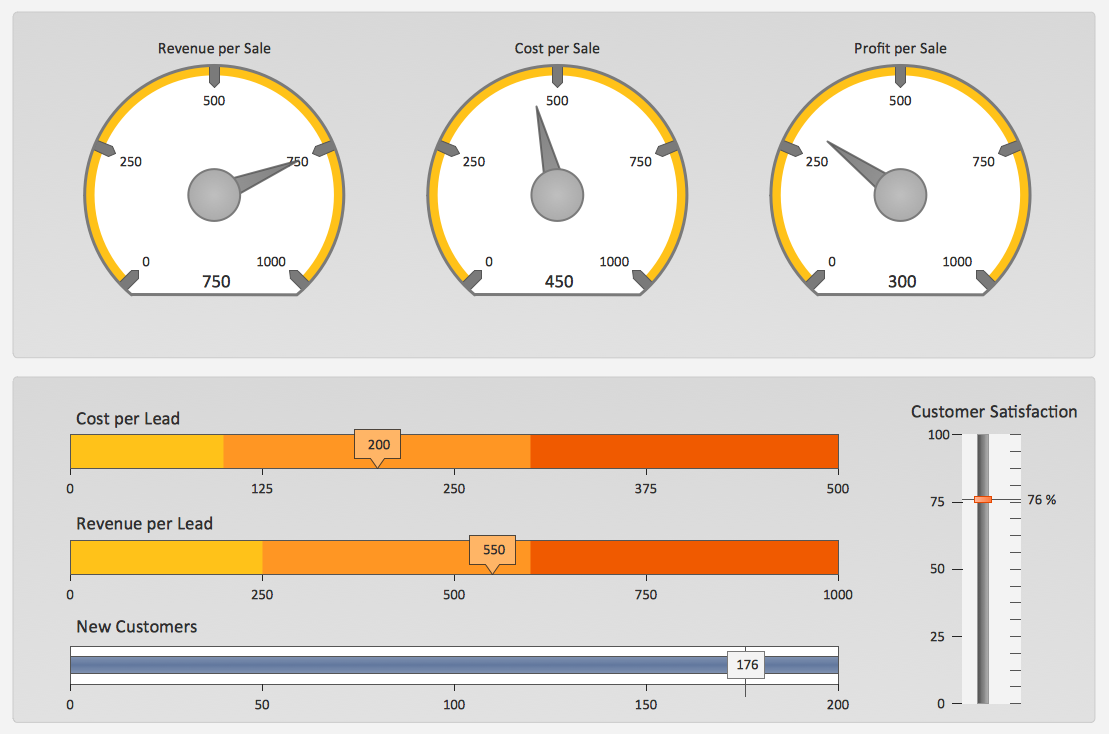
 Sales Dashboard
Sales Dashboard solution extends ConceptDraw DIAGRAM software with templates, samples and library of vector stencils for drawing the visual dashboards of sale metrics and key performance indicators (KPI).
 Comparison Dashboard
Comparison dashboard solution extends ConceptDraw DIAGRAM software with samples, templates and vector stencils library with charts and indicators for drawing the visual dashboard comparing data.
- Kpi Dashboard Requirements Document Template
- Dashboard Requirements Template
- Balanced Scorecard Powerpoint Template
- Balanced Scorecard Format
- How to Use ConceptDraw Sales Dashboard Solution | Status ...
- Sales Dashboard Template | KPI Dashboard | A KPI Dashboard ...
- Excel Scorecard Template
- Project task status dashboard - Template | Sales Dashboard ...
- Requirements Document
- Document Sales Library Dashboard