Structured Systems Analysis and Design Method (SSADM) with ConceptDraw DIAGRAM
Structured Systems Analysis and Design Method SSADM is the method which is used at projecting and analysis of information systems. SSADM is based on the data flow diagrams. At the description of data flows out of the system and into the system DFD, which denote boundaries of the system, are used.Diagram Flow Chart
ConceptDraw DIAGRAM is a software for producing flow charts. The software delivers built-in object libraries with vector stencils that allows you to use RapidDraw technology. By clicking on direction arrows one can add a new object to flowchart. Users can start drawing their own flowchart diagrams in fast and simple way.Activity Network Diagram Method
Activity Network Diagram - This sample was created in ConceptDraw DIAGRAM diagramming and vector drawing software using the Seven Management and Planning Tools solution from the Management area of ConceptDraw Solution Park.This sample shows the PERT (Program Evaluation Review Technique) chart of the request on proposal. A request for proposal (RFP) is a request of the company or the organization to potential suppliers to submit the business proposals for service or goods that it is interested to purchase. The RFP is represented on the initial procurement stage and allows to define the risks and benefits.
Business Processes description with ConceptDraw DIAGRAM
Business Processes description with ConceptDraw. Business-processes it allows to describe functional blocks, for example production and marketing. ConceptDraw lets creation of business processes description using IDEF0 and IDEF2 methods.Booch OOD Diagram
The vector stencils library Booch OOD from the solution Software Engineering contains specific symbols of the Booch method such as class symbols, association symbols, aggregation symbols for ConceptDraw DIAGRAM diagramming and vector drawing software. The Software Engineering solution is contained in the Software Development area of ConceptDraw Solution Park.Gane Sarson Diagram
The vector stencils library Gane-Sarson Notation from the solution Data Flow Diagrams contains specific symbols of the Gane-Sarson notation such as process symbol, connector symbol, jump symbol for ConceptDraw DIAGRAM diagramming and vector drawing software. The Data Flow Diagrams solution is contained in the Software Development area of ConceptDraw Solution Park.An Event-driven Process Chain (EPC) - flowchart used for business process modelling
Event-Driven Process Chain flowcharts for improvement throughout an organisation.ConceptDraw DIAGRAM is a software for making EPC flowcharts to provide business process modelling. Its excellent business process improvement tools.
Total Quality Management Value
The Total Quality Management Diagram solution helps you and your organization visualize business and industrial processes. Create Total Quality Management diagrams for business process with ConceptDraw software.Total Quality Management with ConceptDraw
Total Quality Management (TQM) system is the management method where the confidence in quality of all organization processes is placed foremost. The given method is widely used in production, in educational system, in government organizations and so on.CORRECTIVE ACTIONS PLANNING. Risk Diagram (PDPC)
Risk Diagram (PDPC) - ConceptDraw OFFICE suite is a software for Risks Diagram making. This diagram identifies possible risks in accomplishing corrective actions. With the Risks Diagram, one analyzes each action separately in a tree of all actions and develops a preventive action in response of each potential obstacles or circumstances which may be a risk.
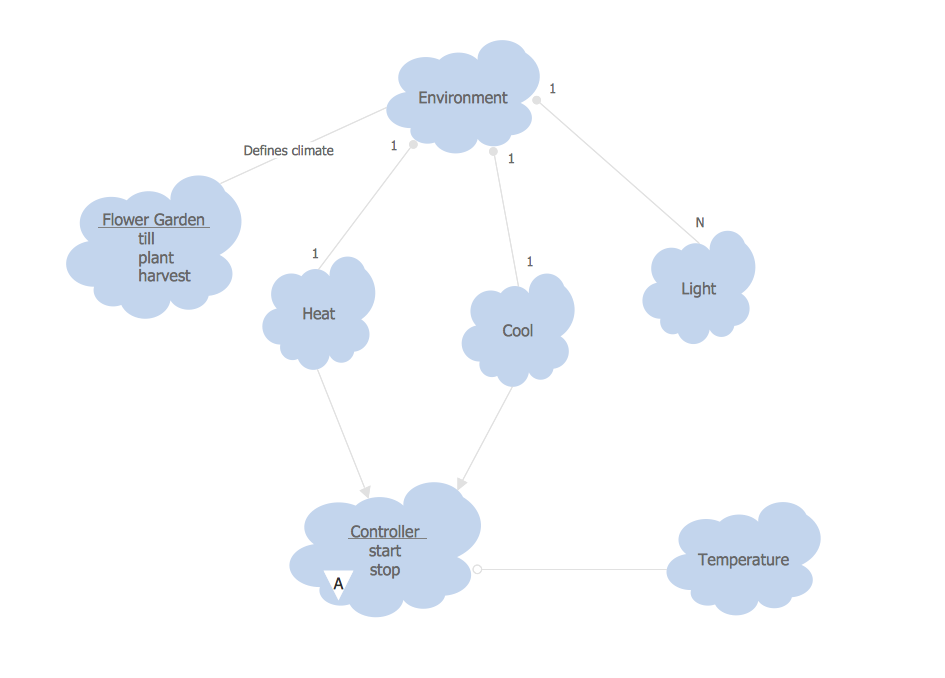
Object-Oriented Development (OOD) Method
This sample shows the Booch OOD diagram of the environment. The Booch method (developed by Grady Booch) is an object modeling language and methodology used in software engineering.This sample was created in ConceptDraw DIAGRAM diagramming and vector drawing software using the Rapid UML Solution from the Software Development area of ConceptDraw Solution Park.
Process Flow app for macOS
Use ConceptDraw DIAGRAM diagramming and business graphics software to draw your own flowcharts of computer algorithms.Using Fishbone Diagrams for Problem Solving
Problems are obstacles and challenges that one should overcome to reach the goal. They are an inseparable part of any business, and the success of an enterprise often depends on ability to solve all problems effectively. The process of problem solving often uses rational approach, helping to find a suitable solution.Using Fishbone Diagrams for Problem Solving is a productive and illustrative tool to identify the most important factors causing the trouble. ConceptDraw DIAGRAM extended with Fishbone Diagrams solution from the Management area of ConceptDraw Solution Park is a powerful tool for problem solving with Fishbone Ishikawa diagram graphic method.
- Business process diagram BPMN 1.2 - Hiring process
- Interactive Voice Response Diagrams | Activity Network Diagram ...
- Taxi service order procedure - BPMN 1.2 diagram | Business ...
- Taxi service order procedure - BPMN 1.2 diagram | Taxi service ...
- Process Flowchart | Business Diagram Software | Business Process ...
- How to Create a BPMN Diagram Using ConceptDraw PRO ...
- Business process diagram BPMN 1.2 - Hiring process | Recruitment ...
- Business process diagram BPMN 1.2 - Hiring process | Basic ...
- Service Process Diagram
- Taxi order process - BPMN 1.2 diagram | Taxi service order ...
- Structured Systems Analysis and Design Method (SSADM) with ...
- Process Flowchart | Fishbone Diagram Procedure | Taxi service ...
- How To Draw Diagram Of Core Business Activities
- Business process diagram BPMN 1.2 - Hiring process | BPMN 2.0 ...
- Business process diagram BPMN 1.2 - Hiring process | Basic ...
- Taxi service order procedure - BPMN 1.2 diagram | Process ...
- Business process diagram BPMN 1.2 - Hiring process | Business ...
- Block Diagram For Business Support System
- Process Of Business Policy Through Diagram
- Taxi service order procedure - BPMN 1.2 diagram | Taxi order ...
- ERD | Entity Relationship Diagrams, ERD Software for Mac and Win
- Flowchart | Basic Flowchart Symbols and Meaning
- Flowchart | Flowchart Design - Symbols, Shapes, Stencils and Icons
- Flowchart | Flow Chart Symbols
- Electrical | Electrical Drawing - Wiring and Circuits Schematics
- Flowchart | Common Flowchart Symbols