Basic Flowchart Symbols and Meaning


Recruitment

How to Draw a Good Diagram of a Business Workflow?

Hiring Process

 HR Flowcharts
Human resource management diagrams show recruitment models, the hiring process and human resource development of human resources.
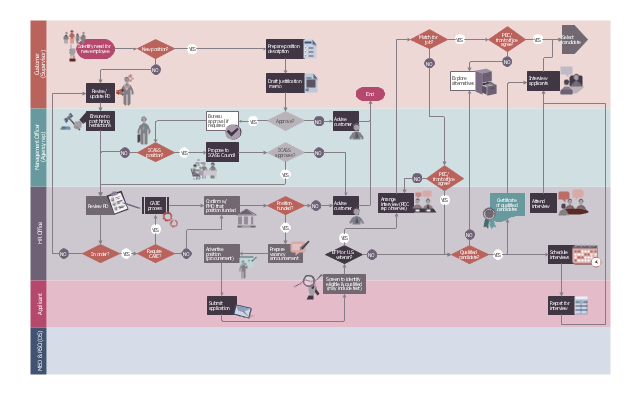
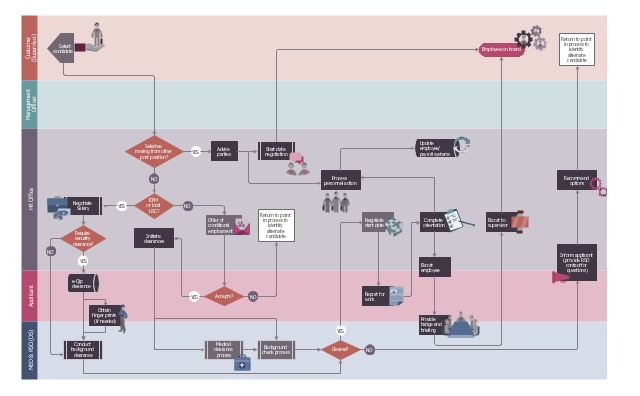
This HR flowchart example was redesigned from the Wikimedia Commons files: File:(5) 2008-07-07 Recruitment pg1.jpg (1st page), File:(5) 2008-07-07 Recruitment pg2.jpg (2nd page).
[commons.wikimedia.org/ wiki/ File:(5)_ 2008-07-07_ Recruitment_ pg1.jpg, commons.wikimedia.org/ wiki/ File:(5)_ 2008-07-07_ Recruitment_ pg2.jpg]
"ROLE OF THE POST EMPLOYMENT COMMITTEE (PEC).
The Post Employment Committee (PEC) ensures the proper application of the US Citizen EFM and US Veterans Hiring Preference is applied." [icass.gov/ home/ Documents/ HR-OE%20 Interagency%20 Docs/ Local%20 Employment%20 Recruitment%20 Policy.pdf]
The cross-functional flowchart example "Post Employment Committee recruitment flowchart" was created using the ConceptDraw PRO diagramming and vector drawing software extended with the HR Flowcharts solution from the Management area of ConceptDraw Solution Park.
Cross-functional flowchart - part 1
Cross-functional flowchart - part 2
 Business Processes Area
Solutions of Business Processes area extend ConceptDraw PRO software with samples, templates and vector stencils libraries for drawing business process diagrams and flowcharts for business process management.
Business Process Modeling Notation

Human Resource Management

This financila dashboard example was drawn on the base of the Enterprise dashboard from the Mecklenburg County Government website.
[charmeck.org/ mecklenburg/ county/ CountyManagersOffice/ OMB/ dashboards/ Pages/ Enterprise.aspx]
"In management information systems, a dashboard is "an easy to read, often single page, real-time user interface, showing a graphical presentation of the current status (snapshot) and historical trends of an organization’s key performance indicators to enable instantaneous and informed decisions to be made at a glance."
For example, a manufacturing dashboard may show key performance indicators related to productivity such as number of parts manufactured, or number of failed quality inspections per hour. Similarly, a human resources dashboard may show KPIs related to staff recruitment, retention and composition, for example number of open positions, or average days or cost per recruitment.
Types of dashboards.
Dashboard of Sustainability screen shot illustrating example dashboard layout.
Digital dashboards may be laid out to track the flows inherent in the business processes that they monitor. Graphically, users may see the high-level processes and then drill down into low level data. This level of detail is often buried deep within the corporate enterprise and otherwise unavailable to the senior executives.
Three main types of digital dashboard dominate the market today: stand alone software applications, web-browser based applications, and desktop applications also known as desktop widgets. The last are driven by a widget engine.
Specialized dashboards may track all corporate functions. Examples include human resources, recruiting, sales, operations, security, information technology, project management, customer relationship management and many more departmental dashboards.
Digital dashboard projects involve business units as the driver and the information technology department as the enabler. The success of digital dashboard projects often depends on the metrics that were chosen for monitoring. Key performance indicators, balanced scorecards, and sales performance figures are some of the content appropriate on business dashboards." [Dashboard (management information systems). Wikipedia]
The example "Enterprise dashboard" was created using the ConceptDraw PRO diagramming and vector drawing software extended with the Composition Dashboard solution from the area "What is a Dashboard" of ConceptDraw Solution Park.
Financial dashboard

Human Resources

- How to Create a HR Process Flowchart Using ConceptDraw PRO ...
- Recruiting Process Flowchart
- Recruitment Process Flowchart In Word
- Employee Recruitment Process Flowchart
- Hr Recruiting Process Flow Chart
- Recruiting Process Flow Chart
- Business process diagram BPMN 1.2 - Hiring process | Business ...
- Recruitment Agency Process Flow
- Business Process Diagram | Cross-Functional Flowcharts | Event ...
- Business Process Model Hiring Process
- Recruitment Process Flow Chart
- Recruiting Process Flow
- Business process diagram BPMN 1.2 - Hiring process | Hiring ...
- Business Process Modeling Notation Template | Business process ...
- Business process diagram BPMN 1.2 - Hiring process | Recruitment ...
- Process Flowchart | Basic Flowchart Symbols and Meaning | HR ...
- Recruitment And Selection Flow Chart Process
- Flow chart Example. Warehouse Flowchart | Business process ...
- Business process diagram BPMN 1.2 - Hiring process