Pyramid Diagram

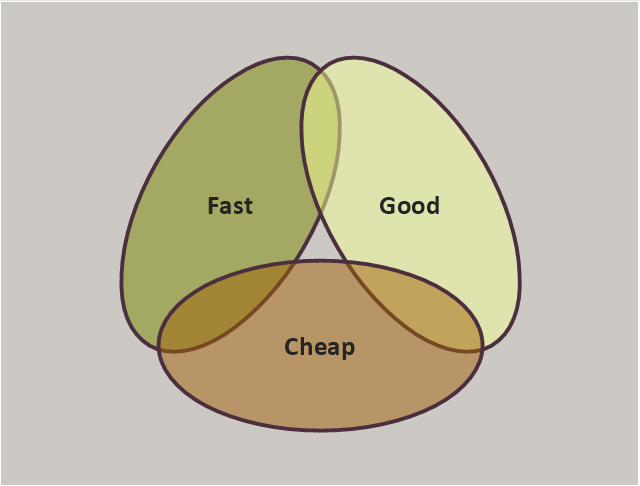
"You are given the options of Fast, Good and Cheap, and told to pick any two. Here Fast refers to the time required to deliver the product, Good is the quality of the final product, and Cheap refers to the total cost of designing and building the product. This triangle reflects the fact that the three properties of a project are interrelated, and it is not possible to optimize all three – one will always suffer."
[Project management triangle. Wikipedia]
A Venn-diagram style chart of the "project triangle" showing visually the potential overlaps between speed, quality and low cost, along with the "inability" to accomplish all three.
The diagram example "Project triangle chart" was redesigned using the ConceptDraw PRO diagramming and vector drawing software from Wikimedia Commons file Project-triangle.svg. [commons.wikimedia.org/ wiki/ File:Project-triangle.svg]
This file is made available under the Creative Commons CC0 1.0 Universal Public Domain Dedication. [creativecommons.org/ publicdomain/ zero/ 1.0/ deed.en]
The triangular chart sample "Project triangle chart" is included in the Pyramid Diagrams solution from the Marketing area of ConceptDraw Solution Park.
Triangular diagram
Pyramid Charts

Pyramid Diagram and Pyramid Chart

Pyramid Diagram

Diagram of a Pyramid

Pyramid Diagram

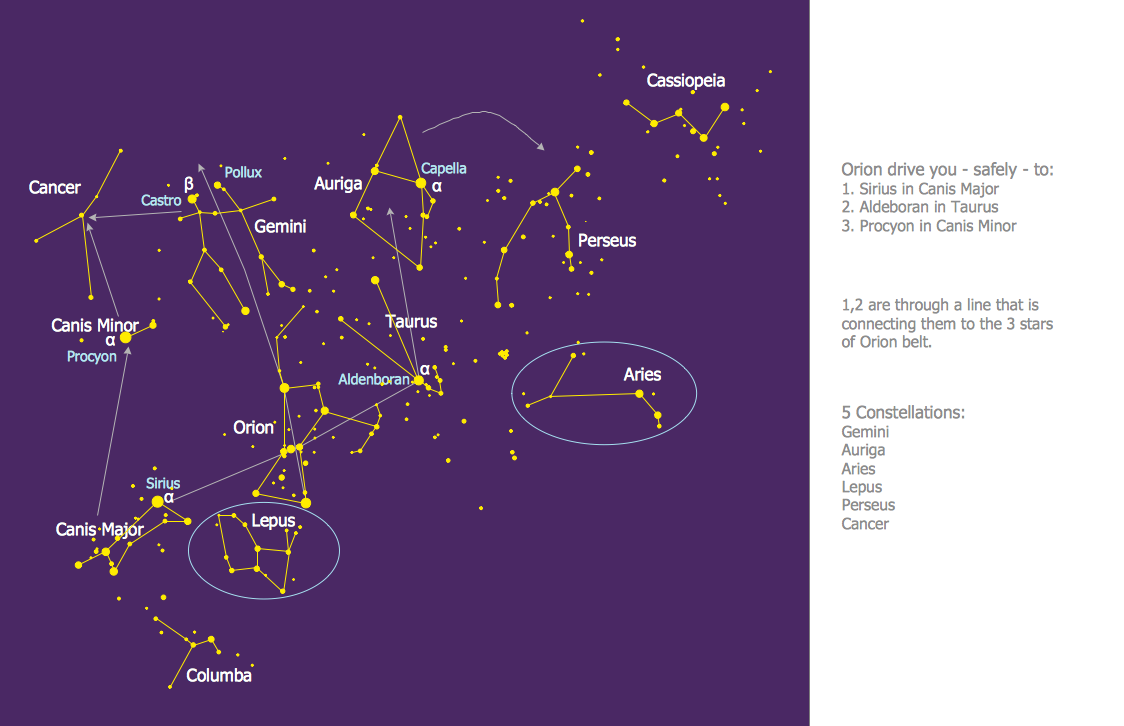
Constellation Chart
Pyramid Diagram

Pyramid Diagram

HelpDesk
How to Create a Timeline Diagram

Pyramid Diagram

Pyramid Diagram

 Pyramid Diagrams
Pyramid Diagrams solution extends ConceptDraw DIAGRAM software with templates, samples and library of vector stencils for drawing the marketing pyramid diagrams.
Pyramid Chart Examples

- Triangle Template For A Pyramid
- 3D Triangle diagram - Template | Pyramid Charts | Pyramid Diagram ...
- Triangle diagram - Template
- Pyramid Charts | Triangle chart - Template | Project triangle chart ...
- Pyramid Diagram and Pyramid Chart | 3-Level 3D pyramid diagram ...
- Pyramid Diagram | Pyramid Diagram | Project triangle chart ...
- 3D Triangle diagram - Template | 3D Segmented pyramid chart ...
- Pyramid Charts
- Pyramid Diagram | Project triangle chart | Triangular chart ...
- Plant Layout Plans | Flow chart Example. Warehouse Flowchart ...
- Flow chart Example. Warehouse Flowchart | Building Drawing ...
- Pyramid Diagram | Project triangle chart | Pyramid Charts | Chart Of ...
- Triangular chart - Template | Project triangle chart | Triangle chart ...
- Cisco Buildings . Cisco icons, shapes, stencils and symbols | UML ...
- Triangle chart - Template | Pyramid Diagram and Pyramid Chart ...
- Pyramid Diagram and Pyramid Chart | Segmented pyramid diagram ...
- Chart Of Triangles With Diagram
- How to Create a Pie Chart | Circular arrows diagrams - Vector ...
- Pyramid Diagram | 3D Triangle diagram - Template | Pyramid Charts ...