Pyramid Diagram

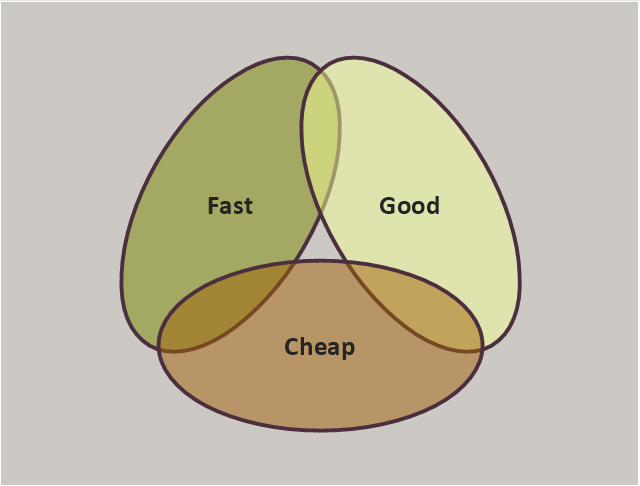
"You are given the options of Fast, Good and Cheap, and told to pick any two. Here Fast refers to the time required to deliver the product, Good is the quality of the final product, and Cheap refers to the total cost of designing and building the product. This triangle reflects the fact that the three properties of a project are interrelated, and it is not possible to optimize all three – one will always suffer."
[Project management triangle. Wikipedia]
A Venn-diagram style chart of the "project triangle" showing visually the potential overlaps between speed, quality and low cost, along with the "inability" to accomplish all three.
The diagram example "Project triangle chart" was redesigned using the ConceptDraw PRO diagramming and vector drawing software from Wikimedia Commons file Project-triangle.svg. [commons.wikimedia.org/ wiki/ File:Project-triangle.svg]
This file is made available under the Creative Commons CC0 1.0 Universal Public Domain Dedication. [creativecommons.org/ publicdomain/ zero/ 1.0/ deed.en]
The triangular chart sample "Project triangle chart" is included in the Pyramid Diagrams solution from the Marketing area of ConceptDraw Solution Park.
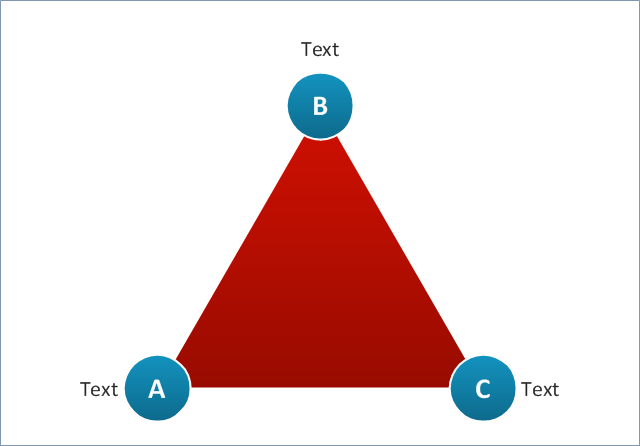
Triangular diagram
Pyramid Charts

Use this triangular pyramid chart template to create your own marketing triangle diagrams using the ConceptDraw PRO diagramming and vector drawing software.
The Triangular pyramid diagram template is included in the Pyramid Diagrams solution from the Marketing area of ConceptDraw Solution Park.
www.conceptdraw.com/ solution-park/ marketing-pyramid-diagrams
The Triangular pyramid diagram template is included in the Pyramid Diagrams solution from the Marketing area of ConceptDraw Solution Park.
www.conceptdraw.com/ solution-park/ marketing-pyramid-diagrams
Triangle chart

Use this triangle diagram template to create your own marketing triangular schemes using the ConceptDraw PRO diagramming and vector drawing software.
The Triangular chart template is included in the Pyramid Diagrams solution from the Marketing area of ConceptDraw Solution Park.
www.conceptdraw.com/ solution-park/ marketing-pyramid-diagrams
The Triangular chart template is included in the Pyramid Diagrams solution from the Marketing area of ConceptDraw Solution Park.
www.conceptdraw.com/ solution-park/ marketing-pyramid-diagrams
Triangular chart
Pyramid Diagram

Pyramid Diagram and Pyramid Chart

Pyramid Chart Examples

Pyramid Diagram

How to Create a Pyramid Diagram

Pyramid Diagram

"The Time/ Money/ Quality Triangle illustrates an advertising truism, that "you can't have all three." If there is little time or money, then ad quality will suffer. The more time and/ or money that is available to the project, the higher the quality can be. However, the level of quality must be appropriate to the product...not all products should have high-quality ads!" [Advertising/ Strategies. Wikibooks]
This triangular diagram example was redesigned using the ConceptDraw PRO diagramming and vector drawing software from Wikimedia Commons file Time-Quality-Money.png. [commons.wikimedia.org/ wiki/ File:Time-Quality-Money.png]
This file is licensed under the Creative Commons Attribution-Share Alike 3.0 Unported license. [creativecommons.org/ licenses/ by-sa/ 3.0/ deed.en]
The chart sample "Time, quality, money triangle diagram" is included in the Pyramid Diagrams solution from the Marketing area of ConceptDraw Solution Park.
Triangular chart

Pyramid Diagram

Pyramid Diagram

Pyramid Diagram

- Triangle chart - Template | Triangular chart - Template | Pyramid ...
- 3d Triangle Chart
- How to Create a Pie Chart | How to Draw the Different Types of Pie ...
- Pyramid Diagram and Pyramid Chart | Pyramid Charts | Triangle ...
- 3D Triangle diagram - Template | Pyramid Charts | Pyramid Diagram ...
- Pyramid Diagram and Pyramid Chart | Arrowed block pyramid ...
- Triangle chart - Template
- Project triangle chart | Pyramid Diagram | Pyramid Diagram ...
- Triangle Marketing Chart
- Pyramid Diagram | Project triangle chart | Triangular chart ...
- Triangle chart - Template | Pyramid diagrams - Vector stencils library ...
- Triangular chart - Template | Project triangle chart | Triangle chart ...
- Pyramid Chart Examples | Pyramid Diagram | Pyramid Charts ...
- Pyramid Diagram | Process Flowchart | Pyramid Diagram | Chart Of ...
- Times Pyramid Chart Triangle
- Pyramid Diagram and Pyramid Chart | Pyramid Charts | 3D ...
- Arrow circle chart - Template | Basic Flowchart Symbols and ...
- Triangular Venn diagram - Template | Triangle chart - Template ...
- Pyramid Charts | Pyramid Diagram | Pyramid Diagram | Triangle ...
- Pyramid Diagram and Pyramid Chart | Math illustrations - Template ...