Basic Diagramming
Perfect charts and graphics diagramming software with rich examples and template. ConceptDraw is ideal to draw Charts and Graphics.
Best Diagramming Software for macOS
ConceptDraw DIAGRAM creates drawings, flowcharts, block diagrams, bar charts, histograms, pie charts, divided bar diagrams, line graphs, area charts, scatter plots, circular arrows diagrams, Venn diagrams, bubble diagrams with great visual appeal on Mac OS X.
ConceptDraw DIAGRAM Compatibility with MS Visio
The powerful diagramming and business graphics tools are now not exception, but the norm for today’s business, which develop in incredibly quick temp. But with the abundance of powerful business diagramming applications it is important to provide their compatibility for effective exchange the information between the colleagues and other people who maybe use different software in their work. During many years Microsoft Visio™ was standard file format for the business and now many people need the visual communication software tools that can read the Visio format files and also export to Visio format. The powerful diagramming and vector drawing software ConceptDraw DIAGRAM is ideal from the point of view of compatibility with MS Visio. Any ConceptDraw DIAGRAM user who have the colleagues that use MS Visio or any who migrates from Visio to ConceptDraw DIAGRAM , will not have any problems. The VSDX (Visio′s open XML file format) and VDX formatted files can be easily imported and exported by ConceptDraw DIAGRAM , you can see video about this possibility.Map Software
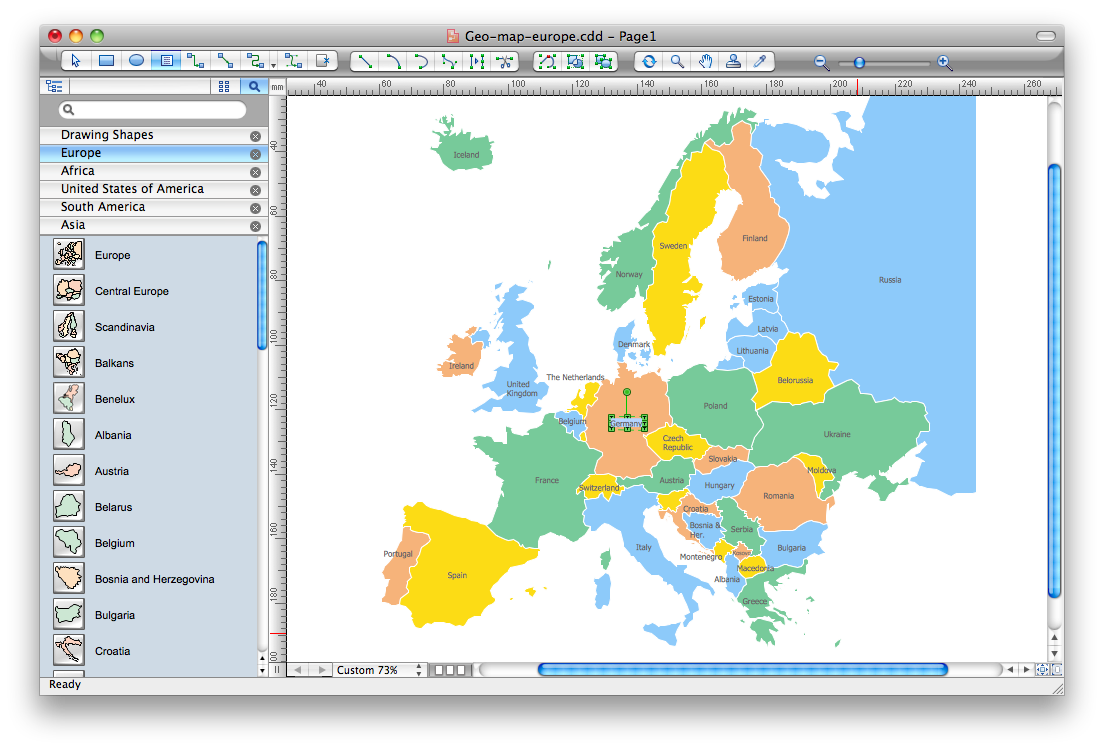
Create maps, flags, and more with ConceptDrawBar Diagram Math
ConceptDraw DIAGRAM extended with Divided Bar Diagrams solution from Graphs and Charts area of ConceptDraw Solution Park is the best software for quick and simple drawing the Divided Bar Diagrams and Bar Diagram Math.Beauty in nature Illustrations and Clipart
Nature solution expands our software possibilities to create beautiful illustrations and cliparts with the new library which contains 17 vector objects.Energy Pyramid Diagram
Energy Pyramid Diagram is a visual graphical representation of the biomass productivity on the each trophic level in a given ecosystem. Its designing in ConceptDraw DIAGRAM will not take much time thanks to the unique Pyramid Diagrams solution from the Marketing area of ConceptDraw Solution Park. Energy Pyramid Diagram begins from the producers (plants) and proceeds through a few trophic levels of consumers (herbivores which eat these plants, the carnivores which eat these herbivores, then carnivores which eat those carnivores, and so on) to the top of the food chain.Export from ConceptDraw DIAGRAM Document to a Graphic File
Now it’s easy to share your visual documents with other people in a form most convenient for them. ConceptDraw DIAGRAM can save your drawings and diagrams in a number of highly useful formats, including graphic files. You can save your drawing as a.PNG,.JPG, or other graphic format file.
Pictures of Graphs
ConceptDraw DIAGRAM diagramming and vector drawing software extended with Picture Graphs solution from the Graphs and Charts Area is the best choice for making professional looking pictures of graphs and colorful picture graphs.Column Chart Software
ConceptDraw Column Chart software allows drawing column charts using predesigned objects or drawing tools. In ConceptDraw Column Chart software you can find a complete set of column chart tools and objects.Spider Chart Template
This sample shows the Spider Chart that represents the budget and spending for one organization and allows to compare them. The multivariate data are represented on the Spider Chart as a two-dimensional chart with four or more variables displayed on the axes that start in one point. The Spider Charts are used in the management, business and sport.Picture Graph
A Picture Graph is a popular and widely used type of a bar graph, which represents data in various categories using the pictures. ConceptDraw DIAGRAM extended with Picture Graphs solution from the Graphs and Charts area of ConceptDraw Solution Park is the best software for fast and simple drawing professional looking Picture Graphs.How can you illustrate the weather condition
Use it to make professional looking documents, presentations, and websites illustrated with color scalable vector clipart for geography, weather, and animals.Onion Diagram Process Design
Onion diagram is a type of circular diagram that consists of the core circle representing the product/solution and concentric circles around it, which dependent on the core and look like the cross sections of onion. ConceptDraw DIAGRAM diagramming and vector drawing software supplied with Stakeholder Onion Diagrams Solution from the Management Area of ConceptDraw Solution Park is an ideal software for effective Onion diagram process design.BPR Diagram. Business Process Reengineering Example
This sample was created in ConceptDraw DIAGRAM diagramming and vector drawing software using the Business Process Diagram Solution from the Business Processes area of ConceptDraw Solution Park. The Business Process Solution is based on the standard BPMN 2.0 and includes the set of libraries of ready-to-use objects.Flowchart Software
Flowchart is a simple diagram, map or graphical schematic representation the sequence of actions within a process. It is ideal for displaying how a process currently flows or can function ideally. The Flowcharts let define the steps and boundaries of a process, uncover problems or miscommunications. The Flowcharts are widely used in education, software development, business, economics, thanks to their visuality they are ideal for presentations, reports, for using on conferences to help the audience comprehend the content better, or easy find flaws in a process flow diagrams. ConceptDraw DIAGRAM is professional flowcharts software and feature-rich flowchart maker, which supports Mac OS X and Windows. It contains at ConceptDraw Solution Park a rich set of stencils and professional flowchart symbols for design. It lets create simply professional-looking Flowcharts based on thousand free flowchart templates, colored symbols and examples. ConceptDraw DIAGRAM is a 3 times cheaper alternative to MS Visio available for both Mac and PC. It’s is another full featured business and technical diagramming application that can easily take care of Visio files within OS X. Another bonus with ConceptDraw DIAGRAM – it's cross-platform. You can work on a document in both OS X and Windows, skipping Visio entirely.
Astronomy Pictures
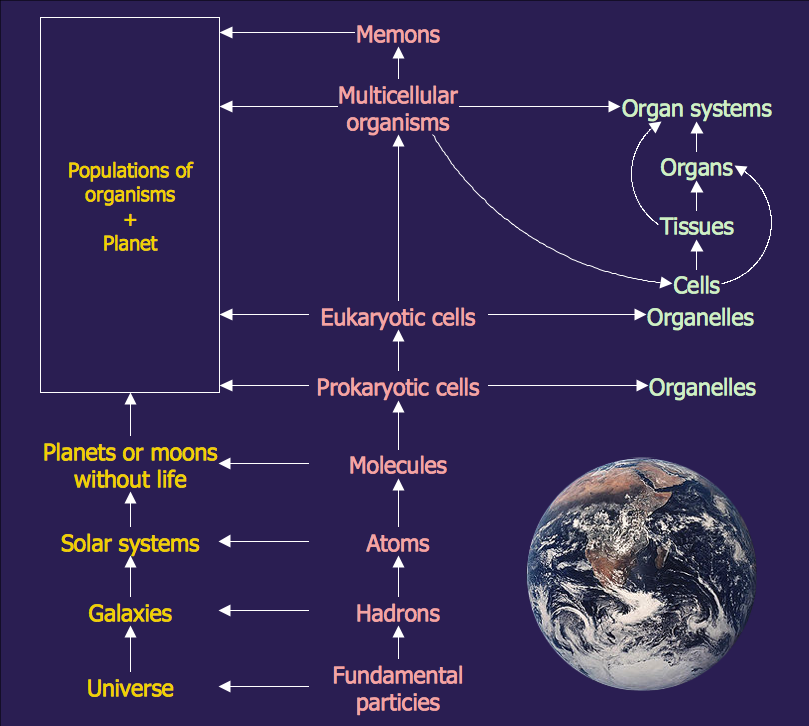
Every day astronomers of the whole world and astronomy-related people draw wide variety of astronomy pictures, make the photos of various astronomic events, solar and planets activities. ConceptDraw DIAGRAM diagramming and vector drawing software extended with Astronomy solution from the Science and Education area is the best choice for astronomy specialists. It gives the possibility to design professional looking astronomy pictures in a few minutes.Pictures of Vegetables
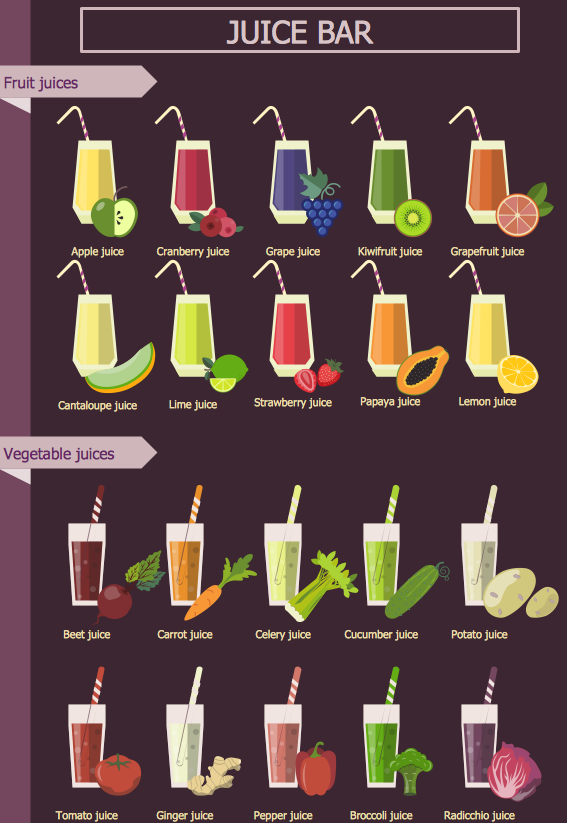
Designing of food images, fruit art illustrations, pictures of vegetables, and many other food and cafe related images and infographics has never been easier than it is now with ConceptDraw DIAGRAM software. ConceptDraw DIAGRAM diagramming and vector drawing software extended with Food Court solution from the Food and Beverage area of ConceptDraw Solution Park is perfect food pictures design software.Bar Charts
ConceptDraw DIAGRAM diagramming and vector drawing software extended with Bar Graphs solution from the Graphs and Charts area of ConceptDraw Solution Park is ideal for drawing the Bar Charts fast and simply.Scatter Graph
You've got to draw the Scatter Graph and look for the convenient tool which will help you? Direct your attention on the ConceptDraw DIAGRAM diagramming and vector drawing software extended with Scatter Diagrams Solution from the Graphs and Charts Area.- Histogram Chart | Making a Histogram | Seven Basic Tools of Quality ...
- Chart Templates | Sales Growth. Bar Graphs Example | Pictures of ...
- Bar Graph | Bar Chart Software | Chart Maker for Presentations ...
- Beautiful Nature Scene: Drawing | How to Draw a Map of North ...
- Bar Chart Software | Column Chart Software | Bar Graphs | Double ...
- Column Chart Software
- CERES data flow diagram | Drawing a Nature Scene | Beauty in ...
- Schedule pie chart - Daily action plan | Chart Maker for ...
- Picture Graph | Beautiful Nature Scene: Drawing | Sefti Image Droing
- Beauty in nature Illustrations and Clipart | Drawing Illustration | How ...
- Bar Chart Software | Pyramid Charts | Chart Maker for Presentations ...
- Beauty in nature Illustrations and Clipart | Use the Best FlowChart ...
- Energy Pyramid Diagram | Pyramid Chart Maker | Diagram of a ...
- Maths Pie Chart Design Image
- Schedule pie chart - Daily action plan | Chart Examples | Bar Graphs ...
- Chart Maker for Presentations | Step Area Graph | Chart Software for ...
- Chart Examples | Draw Company Structure with Organization ...
- Drawing Illustration | How to Draw a Natural Landscape | Beauty in ...
- The Best Drawing Program for Mac | Line Graph Charting Software ...
- Beauty in nature Illustrations and Clipart | Beautiful Nature Scene ...


