Pyramid Diagram and Pyramid Chart
Pyramid Diagram, Triangle Chart or Triangular Diagram is a convenient and useful type of diagrams, which lets represent the data hierarchical structure and to illustrate the foundation-based relationships between the hierarchy levels. Pyramid Diagrams are used to visualize effectively the hierarchical, as well as proportional and foundation-based relationships, the process steps, the interconnections of organizational layers or topics. ConceptDraw PRO software enhanced with Pyramid Diagrams solution from Marketing area of ConceptDraw Solution Park is a powerful business charting software, that includes all required tools for designing the multilevel Pyramid Diagrams as quickly as possible. The build-in vector stencils and templates are the great aid for designers, a variety of examples and samples is a good base and source of inspiration. Use attractive and vivid 2D and 3D Pyramid Diagrams and Triangle Charts designed in ConceptDraw PRO to illustrate your documents, presentations, infographics, articles, reports, websites, etc.Pyramid Chart Examples
Pyramid Charts and Triangle Diagrams are used to visually structure the topics and progressively order the quantitative data. They allow to illustrate hierarchical structure of the topics, proportional, interconnected and containment relations among the topics. The multilevel Pyramids and Triangle diagrams are constructed oriented up or down and divided into several horizontal slices. They are effectively used to represent marketing strategies, social strategies, information systems, market value, etc., to illustrate presentations, websites, documents, reports in business, finances, sales, management, marketing, media, training, consulting, and many other fields. To maximize the efficiency in drawing the Pyramid Charts, use the ConceptDraw PRO diagramming and vector drawing software extended with Pyramid Diagrams solution from Marketing area, which contains the set of Pyramid Chart examples, samples, templates and vector design elements of triangular diagrams and pyramids with different quantity of levels for various needs.Process Flowchart
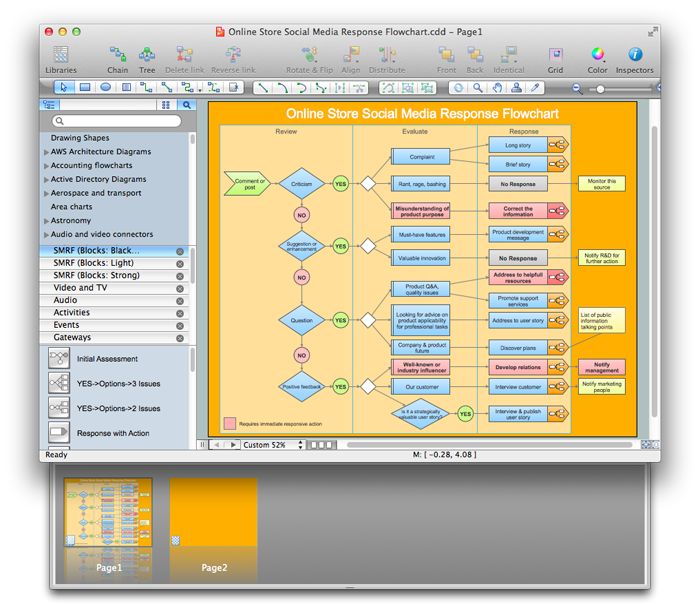
The main reason of using Process Flowchart or PFD is to show relations between major parts of the system. Process Flowcharts are used in process engineering and chemical industry where there is a requirement of depicting relationships between major components only and not include minor parts. Process Flowcharts for single unit or multiple units differ in their structure and implementation. ConceptDraw PRO is Professional business process mapping software for making Process flowcharts, Process flow diagram, Workflow diagram, flowcharts and technical illustrations for business documents and also comprehensive visio for mac application. Easier define and document basic work and data flows, financial, production and quality management processes to increase efficiency of your business with ConcepDraw PRO. Business process mapping software with Flowchart Maker ConceptDraw PRO includes extensive drawing tools, rich examples and templates, process flowchart symbols and shape libraries, smart connectors that allow you create the flowcharts of complex processes, process flow diagrams, procedures and information exchange. Process Flowchart Solution is project management workflow tools which is part ConceptDraw Project marketing project management software. Drawing charts, diagrams, and network layouts has long been the monopoly of Microsoft Visio, making Mac users to struggle when needing such visio alternative like visio for mac, it requires only to view features, make a minor edit to, or print a diagram or chart. Thankfully to MS Visio alternative like ConceptDraw PRO software, this is cross-platform charting and business process management tool, now visio alternative for making sort of visio diagram is not a problem anymore however many people still name it business process visio tools.
Pyramid Charts
ConceptDraw PRO extended with Pyramid Diagrams Solution from the Marketing Area of ConceptDraw Solution Park is a powerful Pyramid Charts making software. A Pyramid Chart has the form of triangle and hierarchically structures, organizes and help to analyze the information, data or ideas. Triangle is divided on the sections that usually have different widths. The width indicates the level of hierarchy among the topics.Sales Process Flowchart Symbols
The most easier way of creating the visually engaging and informative Sales Process Flowchart is to create the new ConceptDraw document and to use the predesigned vector symbols offered in 6 libraries of the Sales Flowchart Solution. There are more than six types of sales process flow diagrams, ConceptDraw PRO software is flowchart maker which include six collections of extended flowchart symbols for effective diagramming. There are main collections of color coded flowchart symbols: Sales Department, Sales Steps, Sales Workflow, Sales Symbols and special set of Sales Arrows and Sales Flowchart.Customer Relationship Management
Customer relationship management is an important component of sales success. Visualizing sales data you may put some KPI related to customers relationship management to your Sales dashboard and track this important aspect in real time.Competitor Analysis
Competitor analysis is a first and obligatory step in elaboration the proper corporate marketing strategy and creating sustainable competitive advantage. Use powerful opportunities of numerous solutions from ConceptDraw Solution Park for designing illustrative diagrams, charts, matrices which are necessary for effective competitor analysis.Planogram
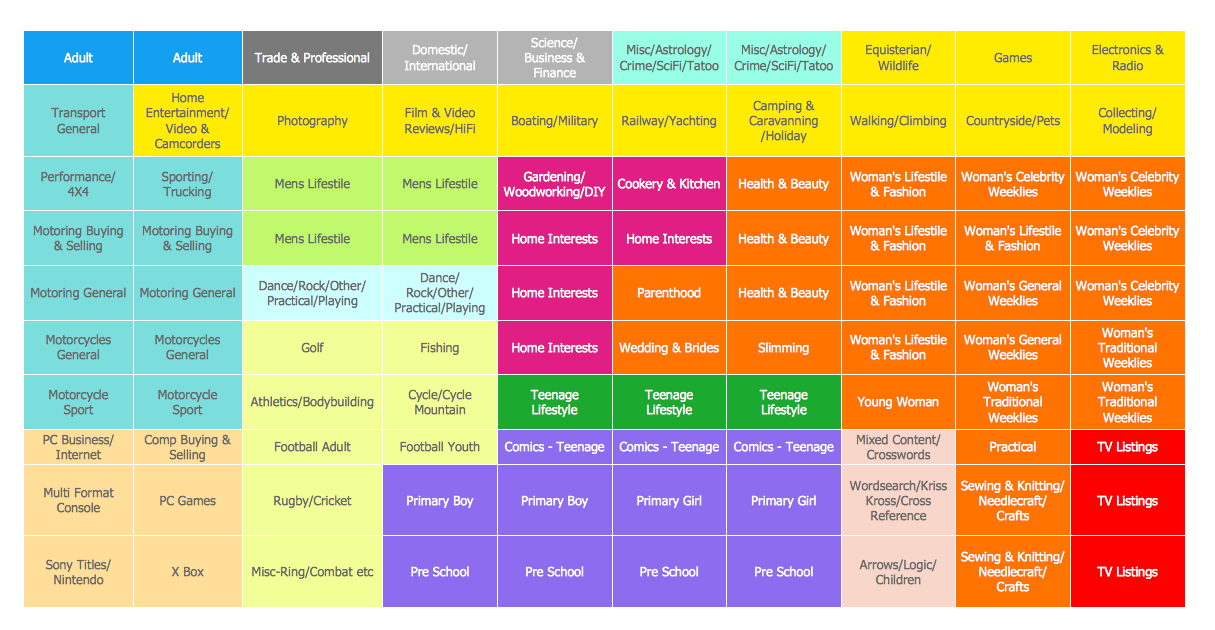
This example shows the planogram for magazines. This example was created in ConceptDraw PRO diagramming and vector drawing software using the Basic Diagramming Solution from the Universal Diagramming area of ConceptDraw Solution Park.Business Productivity - Quality
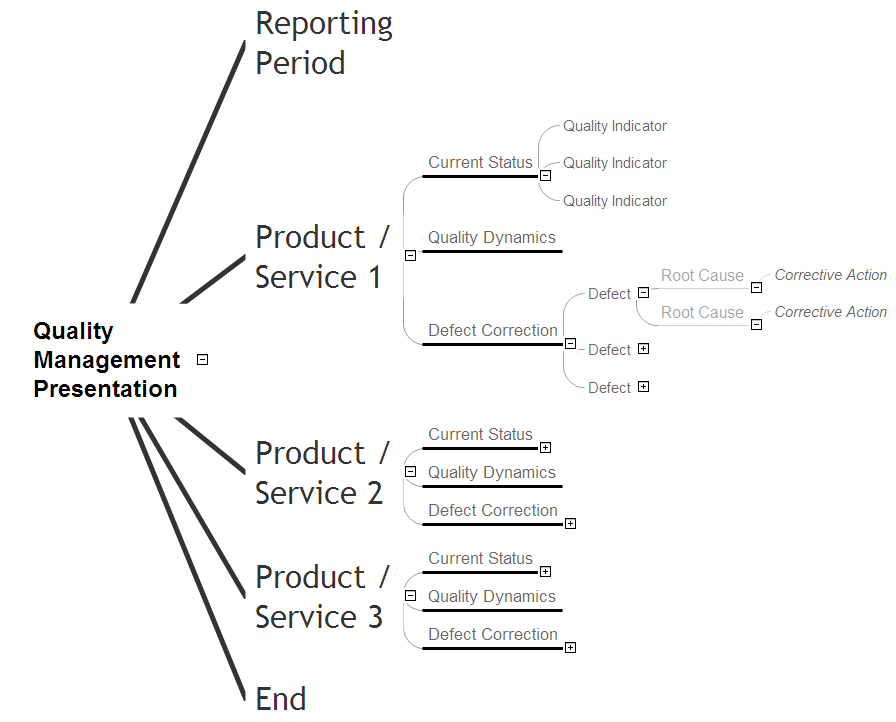
Quality control is a process directed on the maintaining of proper standards in manufacturing and engineering, on the monitoring of manufacturing defects and their elimination. The quality control process is quite capacious and extensive, and in many cases requires the use of specialized software in help to quality managers, to facilitate their work. This process will be effective with Flowcharts and Mind Maps that are recognized as the main tools in quality management, and are perfect for visualization the key quality points, quality instructions and depiction in details the quality control process. The ideal software for Mind Maps design is offered by ConceptDraw Office suite, it is a ConceptDraw MINDMAP. The Quality Mind Maps solution included to ConceptDraw Solution Park and ConceptDraw MINDMAP application provide creative and professional approach to business productivity and visualization quality processes. They support you in tasks of drawing Quality Management Diagrams and Mind Maps, such as Value Stream Maps, Total Quality Management Mind Maps, Quality Management Presentations, Quality Meeting Diagrams, etc.Comparing ConceptDraw PRO to Omnigraffle
Comparing ConceptDraw PRO to Omnigraffle you can see a lot of benefits of ConceptDraw products. First the main, ConceptDraw applications are cross-platform and available in two independent and concurrent versions for Macintosh (OS X) and PC (Windows). ConceptDraw gives you the per named license, that you can use simultaneously for your both Macintosh and PC, at work and at home. Free access to the ConceptDraw Solution Park offers you great number of solutions with hundreds of templates and samples, and thousands of ready-to-use vector objects for quick and easy creation diagrams, drawings, illustrations and Mind Maps. Besides, thanks to the Ingyre Technology is provided the integration with Microsoft Office applications and capabilities of limitless exchange the information. The ConceptDraw Live Objects technology lets you design the visual dynamically-updated dashboards, the Rapid Draw technology allows create the diagrams in minutes. The extensive presentation capabilities help you create lush and beautiful presentation slideshows from your ConceptDraw documents.Planogram Software and Retail Plan Software
The ConceptDraw PRO Planogram Software and Retail Plan Software offers powerful tools of Enterprise Architecture Diagrams Solution for visualization the market analysis and easy making successful Retail Plans and Planograms with useful detailed recommendations about placing products and optimization the shelf space.How to Help Customers be More Productive
Presenting you with a drawing program which could really surprise you with their great functionality. Don't know how to start to draw Connector's improvement? Curious how should diagramming software work? Drawing programs involve a lot of things like designs in an illustrative way, creating an cherts, Tools to create high end graphics, create dashboards, using your data and many other technical aspects do it in a much professional and in a quick way.Agile Methodology
Agile methodology is an excellent alternative to waterfall and traditional sequential development. ConceptDraw PRO software extended with SCRUM Workflow solution is ideal for quick and easy designing various diagrams, charts, mind maps and schematics illustrating software development using Agile methodologies, and in particular Scrum methodology.Process Flow Diagram
A Process Flow Diagram (PFD) is a diagram which shows the relationships between the main components in a system. Process Flow Diagrams are widely used by engineers in chemical and process engineering, they allows to indicate the general flow of plant process streams and equipment, helps to design the petroleum refineries, petrochemical and chemical plants, natural gas processing plants, and many other industrial facilities. ConceptDraw PRO diagramming and vector drawing software extended with powerful tools of Flowcharts Solution from the "Diagrams" Area of ConceptDraw Solution Park is effective for drawing: Process Flow Diagram, Flow Process Diagram, Business Process Flow Diagrams.- Benefits and cons of car leasing - Presentation slide | Marketing ...
- Six Markets Model Chart
- Benefits and cons of car leasing - Presentation slide | Road transport ...
- Marketing - Vector stencils library | Internet marketing - Concept map ...
- Internet marketing - Concept map | Marketing - Vector stencils library ...
- Marketing - Vector stencils library | Flow chart Example. Warehouse ...
- Marketing - Vector stencils library | Bull Diagram Need Analysis
- Block diagram - Customer decision making | Block Diagram ...
- Aircraft - Vector stencils library | Marketing - Vector stencils library ...
- Marketing - Vector stencils library | Types of Flowcharts | Block Box ...
- Design elements - Marketing | Marketing - Design Elements ...
- Marketing - Vector stencils library | Design elements - Marketing ...
- Decision Making | Block diagram - Customer decision making ...
- Use the Best FlowChart Tool for the Job | Affinity diagram - Checkout ...
- Flowchart Benefits
- Basic Flowchart Symbols and Meaning | Process decision program ...
- Basic Flowchart Symbols and Meaning | Marketing Flow Chart ...
- Benefit Or Purpose Of Influence Diagrams
- Benefits Of Decision Tree Analysis
- Decision Tree Benefits


