Bar Diagrams for Problem Solving. Create economics and financial bar charts with Bar Graphs Solution

Export from ConceptDraw PRO Document to a Graphic File


 Bar Graphs
The Bar Graphs solution enhances ConceptDraw PRO v10 functionality with templates, numerous professional-looking samples, and a library of vector stencils for drawing different types of Bar Graphs, such as Simple Bar Graph, Double Bar Graph, Divided Bar Graph, Horizontal Bar Graph, Vertical Bar Graph, and Column Bar Chart.
Bar Chart Examples

Sales Growth. Bar Graphs Example

Bar Graph

Venn Diagram Examples for Problem Solving. Environmental Social Science. Human Sustainability Confluence

The 3D vertical bar graph sample shows the Iran internet users per 100 person from 2000 to 2011. It was designed on the base of the Commons Wikimedia file: Iran internet users per 100 person.png.
[commons.wikimedia.org/ wiki/ File:Iran_ internet_ users_ per_ 100_ person.png]
This file is licensed under the Creative Commons Attribution-Share Alike 3.0 Unported license. [creativecommons.org/ licenses/ by-sa/ 3.0/ deed.en]
The data source is World Bank: [data.worldbank.org/ country/ iran-islamic-republic]
"In 1993 Iran became the second country in the Middle East to be connected to the Internet, and since then the government has made significant efforts to improve the nation's ICT infrastructure. Iran's national Internet connectivity infrastructure is based on two major networks: the public switched telephone network (PSTN) and the public data network. The PSTN provides a connection for end-users to Internet service providers (ISPs) over mostly digital lines and supports modem-based connections. The Data Communication Company of Iran (DCI), a subsidiary of TCI, operates the public data network." [Internet in Iran. Wikipedia]
The 3D column chart example "Iran internet users per 100 person" was created using the ConceptDraw PRO diagramming and vector drawing software extended with the Bar Graphs solution from the Graphs and Charts area of ConceptDraw Solution Park.
3D Column chart

Bar Diagrams for Problem Solving. Create space science bar charts with Bar Graphs Solution

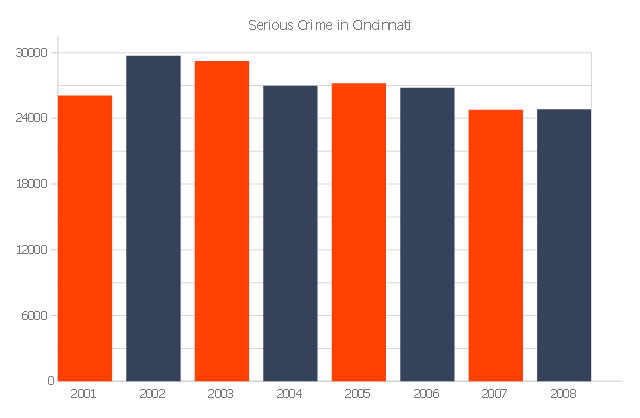
The vertical bar graph sample shows the serious crime number in Cincinnati from 2001 to 2008. It was designed on the base of the Commons Wikimedia file: Cincinnati-Part-1-Crimes.jpg.
[commons.wikimedia.org/ wiki/ File:Cincinnati-Part-1-Crimes.jpg]
"Before the riot of 2001, Cincinnati's overall crime rate was dropping dramatically and had reached its lowest point since 1992. After the riot violent crime increased. Reflecting national trends, crime rates in Cincinnati have dropped in all categories from 2006 to 2010." [Crime in Cincinnati. Wikipedia]
The column chart example "Serious crime in Cincinnati" was created using the ConceptDraw PRO diagramming and vector drawing software extended with the Bar Graphs solution from the Graphs and Charts area of ConceptDraw Solution Park.
Column graph
How To Do A Mind Map In PowerPoint

Bar Diagrams for Problem Solving. Create manufacturing and economics bar charts with Bar Graphs Solution

Bar Diagrams for Problem Solving. Create business management bar charts with Bar Graphs Solution

Financial Comparison Chart

Process Flowchart


- Waterfall Bar Chart | SSADM Diagram | Design elements ...
- Pictures of Graphs | Food Pictures | Pictures of Food | Pict Page1 ...
- 3D Bar graph - Number of Members in the CNT between 1911 and ...
- Png Nature
- Png Series
- Stomach Vector Png
- Bar Chart Software | Column Chart Software | Chart Maker for ...
- Line Graph Examples For Students
- Picture Graphs | Sales Growth. Bar Graphs Example | Picture Graph ...
- Png Clipart Double Arrows
- Column Vector Png
- Bar Diagrams for Problem Solving. Create economics and financial ...
- Bar Diagrams for Problem Solving. Create event management bar ...
- Samples Of Social Mapping In Png
- How to Create Data-driven Infographics | Data Driven Strategies ...
- Company Bar Graphs
- Sector weightings - Exploded pie chart | Bar Diagrams for Problem ...
- Vertical White Line Transparent Png
- Entity-Relationship Diagram (ERD) | Money In Transit Vector Png
- Bar Graph