 Bar Graphs
The Bar Graphs solution enhances ConceptDraw PRO v10 functionality with templates, numerous professional-looking samples, and a library of vector stencils for drawing different types of Bar Graphs, such as Simple Bar Graph, Double Bar Graph, Divided Bar Graph, Horizontal Bar Graph, Vertical Bar Graph, and Column Bar Chart.
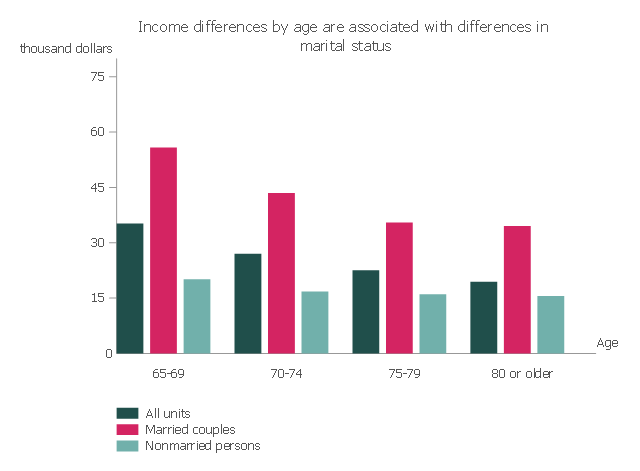
This vertical bar chart sample shows the income differences by age are associated with differences in marital status. It was designed on the base of the bar graph from the webpage "Income of the Aged Chartbook, 2008" on the website of the Social Security Administration, the U.S. Office of Retiriment and Disability Policy.
[ssa.gov/ policy/ docs/ chartbooks/ income_ aged/ 2008/ iac08.html]
"The United States Social Security Administration (SSA) is an independent agency of the United States federal government that administers Social Security, a social insurance program consisting of retirement, disability, and survivors' benefits. To qualify for most of these benefits, most workers pay Social Security taxes on their earnings; the claimant's benefits are based on the wage earner's contributions. Otherwise benefits such as Supplemental Security Income (SSI) are given based on need." [Social Security Administration. Wikipedia]
The column chart example "Median income, by age and marital status" was created using the ConceptDraw PRO diagramming and vector drawing software extended with the Bar Graphs solution from the Graphs and Charts area of ConceptDraw Solution Park.
Column chart
Bar Diagrams for Problem Solving. Create manufacturing and economics bar charts with Bar Graphs Solution

Scatter Graph Charting Software

Line Graph Charting Software

 Divided Bar Diagrams
The Divided Bar Diagrams Solution extends the capabilities of ConceptDraw PRO v10 with templates, samples, and a library of vector stencils for drawing high impact and professional Divided Bar Diagrams and Graphs, Bar Diagram Math, and Stacked Graph.
Chart Software for Better Presentations

Polar Graph

Scatter Graph

Social Media Flowchart Symbols

Chart Examples

Chart Templates

Scatter Chart Examples

Scatter Plot

- Bar Graphs | Average Household Income Usa
- Map of median household income in Australia | Bar Graphs ...
- Map of median household income in Australia | Continent Maps ...
- Financial Comparison Chart | Bar Diagrams for Problem Solving ...
- Bar Graphs | Sales Growth. Bar Graphs Example | Picture Graphs ...
- Scatter Graph Charting Software | Bar Graphs | Line Graph Charting ...
- Bar Diagrams for Problem Solving. Create economics and financial ...
- How to Draw a Divided Bar Chart in ConceptDraw PRO | Divided ...
- Map of median household income in Australia | Map of median ...
- Map of median household income in Australia | Shares of aggregate ...
- Map of median household income in Australia | Cause and effect ...
- How To Draw Bar Graph Of Continents
- Accounting Flowchart Symbols | Basic Scatter Diagrams | Bar Chart ...
- Bar Graphs | Education Package | Basic Bar Graphs | Australia ...
- Bar Graphs | How to Draw a Line Graph | Line Graphs | Graph
- Scatter Graph Charting Software | Accounting Data Flow from the ...
- Line Chart Template for Word | Sales Growth. Bar Graphs Example ...
- Design elements - Picture bar graphs | Picture graphs - Vector ...
- Percentage Pie Chart. Pie Chart Examples | Percentage of the top 1 ...
- Chart Examples | Line Graphs | Line Chart Examples | Percent ...