Accounting Flowchart Symbols

 Basic Scatter Diagrams
This solution extends ConceptDraw DIAGRAM (or later) with templates, samples and a library of vector stencils for drawing Scatter Diagrams.
Bar Chart Software

The vector stencils library "Business" contains 24 business icons.
Use it to design your business and finance illustrations and infographics with ConceptDraw PRO diagramming and vector drawing software.
"A business, also known as an enterprise, or a firm, is an entity involved in the provision of goods and/ or services to consumers. Businesses are prevalent in capitalist economies, where most of them are privately owned and provide goods and services to customers in exchange for other goods, services, or money. Businesses may also be social non-profit enterprises or state-owned public enterprises targeted for specific social and economic objectives. A business owned by multiple individuals may be formed as an incorporated company or jointly organised as a partnership. Countries have different laws that may ascribe different rights to the various business entities." [Business. Wikipedia]
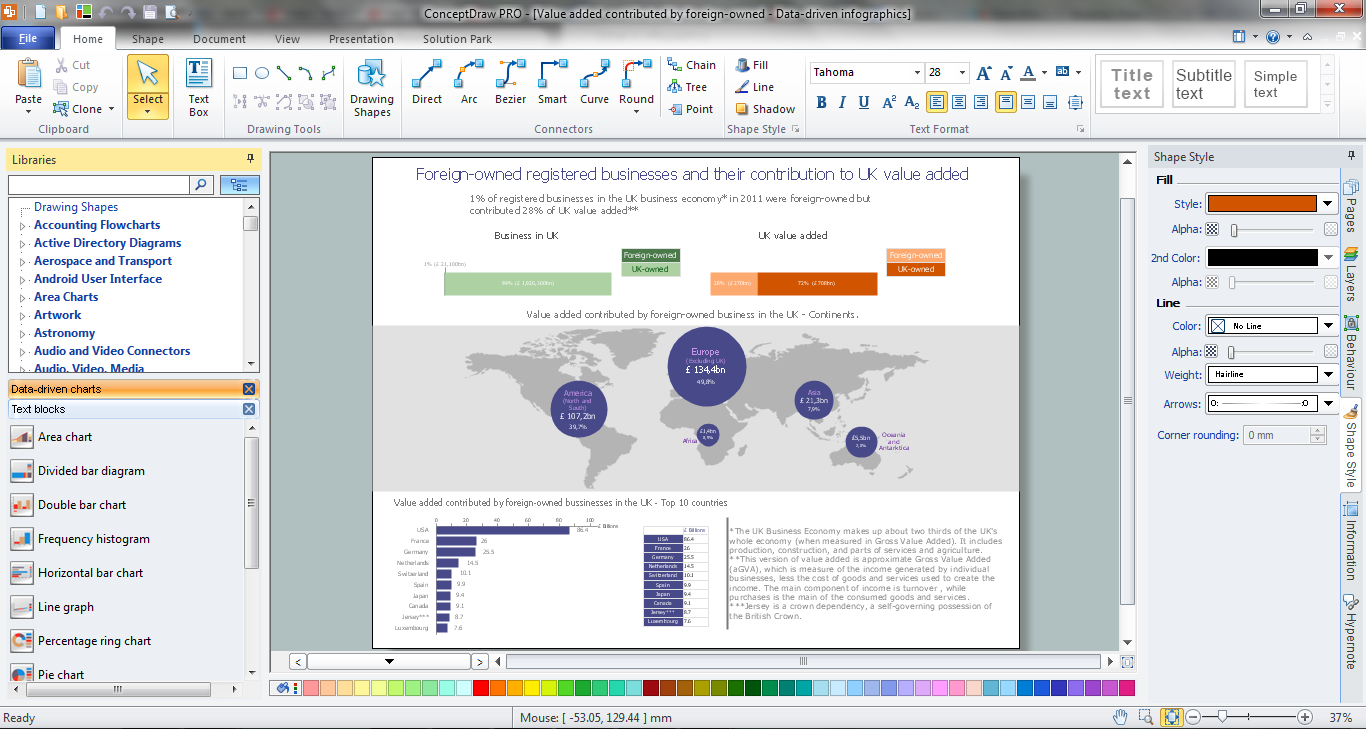
The icon set example "Design elements - Business" is included in the Business and Finance solution from Illustration area of ConceptDraw Solution Park.
Use it to design your business and finance illustrations and infographics with ConceptDraw PRO diagramming and vector drawing software.
"A business, also known as an enterprise, or a firm, is an entity involved in the provision of goods and/ or services to consumers. Businesses are prevalent in capitalist economies, where most of them are privately owned and provide goods and services to customers in exchange for other goods, services, or money. Businesses may also be social non-profit enterprises or state-owned public enterprises targeted for specific social and economic objectives. A business owned by multiple individuals may be formed as an incorporated company or jointly organised as a partnership. Countries have different laws that may ascribe different rights to the various business entities." [Business. Wikipedia]
The icon set example "Design elements - Business" is included in the Business and Finance solution from Illustration area of ConceptDraw Solution Park.
Icon set
Scatter Plot

Timeline Diagrams

 Divided Bar Diagrams
The Divided Bar Diagrams Solution extends the capabilities of ConceptDraw DIAGRAM with templates, samples, and a library of vector stencils for drawing high impact and professional Divided Bar Diagrams and Graphs, Bar Diagram Math, and Stacked Graph.
The vector stencils library "Business" contains 24 business icons.
Use it to design your business and finance illustrations and infographics with ConceptDraw PRO diagramming and vector drawing software.
The vector stencils library "Business" is included in the Business and Finance solution from the Illustration area of ConceptDraw Solution Park.
Use it to design your business and finance illustrations and infographics with ConceptDraw PRO diagramming and vector drawing software.
The vector stencils library "Business" is included in the Business and Finance solution from the Illustration area of ConceptDraw Solution Park.
Company

Office branch

Bank

Income

Exchange

Business statistics

Mechanism

Commerce

Handshake

Business contract

Reporting

Risk

Targeting

Key to success

Transcontinental corporation

Credit debt

Taxes
Bankruptcy

Money case

ATM
Cash register

Buying

Exhibition

Delivery

 Timeline Diagrams
Timeline Diagrams solution extends ConceptDraw DIAGRAM diagramming software with samples, templates and libraries of specially developed smart vector design elements of timeline bars, time intervals, milestones, events, today marker, legend, and many other elements with custom properties, helpful for professional drawing clear and intuitive Timeline Diagrams. Use it to design simple Timeline Diagrams and designate only the main project stages, or highly detailed Timeline Diagrams depicting all project tasks, subtasks, milestones, deadlines, responsible persons and other description information, ideal for applying in presentations, reports, education materials, and other documentation.
Competitor Analysis

Infographic Tools
 Pie Charts
Pie Charts are extensively used in statistics and business for explaining data and work results, in mass media for comparison (i.e. to visualize the percentage for the parts of one total), and in many other fields. The Pie Charts solution for ConceptDraw DIAGRAM offers powerful drawing tools, varied templates, samples, and a library of vector stencils for simple construction and design of Pie Charts, Donut Chart, and Pie Graph Worksheets.
Scatter Graph

SWOT Template

- Accounting Flowchart Symbols | Bar Chart Software | Timeline ...
- Finance Commission Diagram
- Basic Flowchart Symbols and Meaning | Audit Flowchart Symbols ...
- How Australians spend their tax refunds | Changes in Top 1 ...
- Currency - Vector stencils library | UML Activity Diagram | Currency ...
- Pyramid Diagram | UML Activity Diagram | Map of median ...
- Vector Tax Png
- Pyramid Diagram | Business - Vector stencils library | Design ...
- HR workflow - Vector stencils library | Total Quality Management ...
- Management - Vector stencils library | Management pictograms ...
- Bar Diagrams for Problem Solving. Create economics and financial ...
- Tax Png
- Business people - Vector stencils library | Business people - Vector ...
- UML activity diagram - Payment process | UML component diagram ...
- Map of median household income in Australia | Shares of aggregate ...
- SmartAmerica Challenge - Timeline | Tax Time 2013 - System ...
- How to Track Your Project Plan vs. the Actual Project Condition ...
- Pie Charts | How to Draw a Pie Chart Using ConceptDraw PRO ...
- Effects of taxes and benefits | Cause and effect diagram - Increase in ...
- Employee Icon Png