Cause and Effect Diagram

This data-driven infographic example was redesigned from the Wikimedia Commons file: File:Effects of tax and benefits on household income in the UK 2011 - 2012.png.
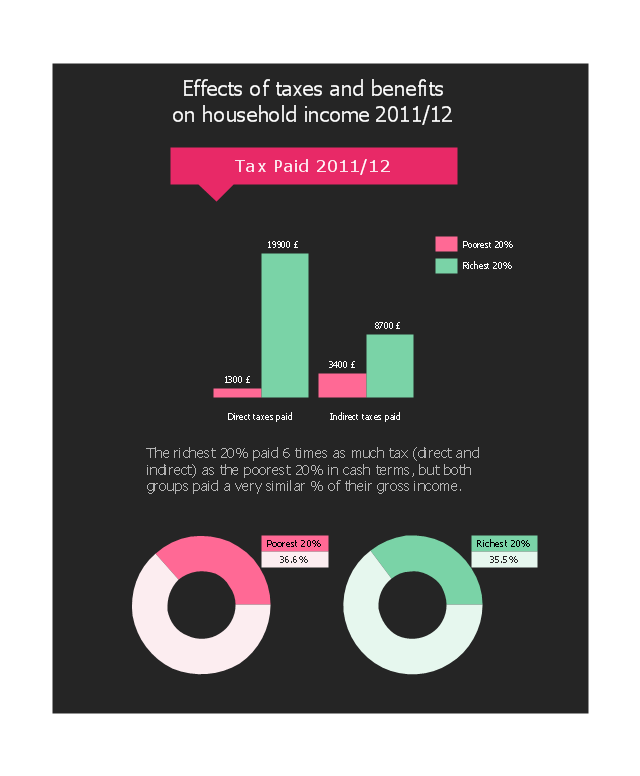
"Before taxes and benefits, the richest fifth of households had an average income of £78,300 in 2011/ 12, 14 times greater than the poorest fifth, who had an average income of £5,400.
Overall, taxes and benefits lead to income being shared more equally between households. After all taxes and benefits are taken into account, the ratio between the average incomes of the top and the bottom fifth of households (£57,300 per year and £15,800 respectively) is reduced to four-to-one."
[commons.wikimedia.org/ wiki/ File:Effects_ of_ tax_ and_ benefits_ on_ household_ income_ in_ the_ UK_ 2011_ -_ 2012.png]
The bar graph and donut chart sample "Effects of taxes and benefits" was created using the ConceptDraw PRO diagramming and vector graphics software extended with the Data-driven Infographics" solution from the area "What is infographics" of ConceptDraw Solution Park.
Data-driven infographics
This cause and effect diagram sample was redesigned from the Wikimedia Commons file: Ursache Wirkung Diagramm Beispiel.png. [commons.wikimedia.org/ wiki/ File:Ursache_ Wirkung_ Diagramm_ Beispiel.png]
This file is licensed under the Creative Commons Attribution-Share Alike 3.0 Unported license. [creativecommons.org/ licenses/ by-sa/ 3.0/ deed.en]
"Productivity is the ratio of output to inputs in production; it is an average measure of the efficiency of production. Efficiency of production means production’s capability to create incomes which is measured by the formula real output value minus real input value.
Productivity is a crucial factor in production performance of firms and nations. Increasing national productivity can raise living standards because more real income improves people's ability to purchase goods and services, enjoy leisure, improve housing and education and contribute to social and environmental programs. Productivity growth also helps businesses to be more profitable." [Productivity. Wikipedia]
The fishbone diagram example "Increase in productivity" was created using the ConceptDraw PRO diagramming and vector drawing software extended with the Fishbone Diagrams solution from the Management area of ConceptDraw Solution Park.
Ishikawa diagram

Business Productivity - Marketing

Cause and Effect Analysis - Fishbone Diagrams for Problem Solving

Cause and Effect Analysis


Flowchart design. Flowchart symbols, shapes, stencils and icons


Cause and Effect Diagram Software

Cause and Effect Diagrams

This typography infographics example was redesigned from the Wikimedia Commons file: Sentido jerarquico de las normas.png. [commons.wikimedia.org/ wiki/ File:Sentido_ jerarquico_ de_ las_ normas.png]
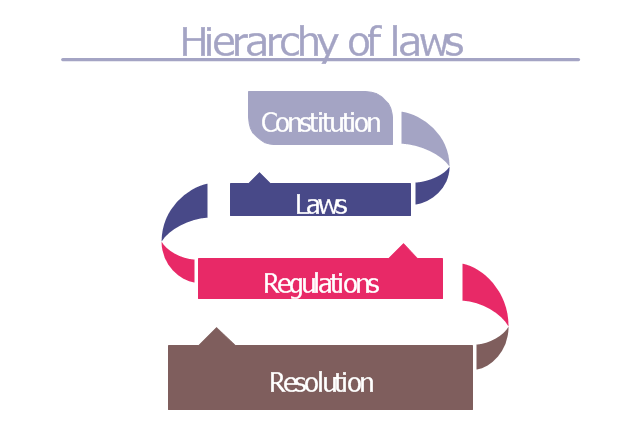
"Hierarchy of laws.
Article 1.2 of the Spanish Civil Code establishes that inferior and superior laws to be distinguished. However, the relationship between laws is not limited to a question of hierarchy, but also relationships of competency exist between some laws and others.
With effect to this, the Spanish Constitution of 1978 is the supreme law, which regulates all the complex relationships between the different laws and their place in the hierarchy.
The hierarchy of Spanish laws is thus:
(1) The Constitution.
(2) International treaties.
(3) The law in its strict sense: Organic Law (which requires an absolute majority from the Cortes Generales), ordinary law and regulatory laws (amongst which are found the Royal Decree of Law and the Legislative Royal Decree).
(4) Laws stemming from the executive, with its own hierarchy based on the function of the body that made them (Royal Decree, Decree, Ministerial Order, etc.)." [Law of Spain. Wikipedia]
The infographics example "Hierarchy of laws" was created using the ConceptDraw PRO diagramming and vector drawing software extended with the Typography Infographics solition from the area "What is infographics" in ConceptDraw Solution Park.
Infographics
- Png Earthquake Effect
- Conservation Of Natural Png
- Dining Table Plan Image In Png
- Water Fountain Texture Png
- Landscape & Garden | Building Design Package | Fountain Png Top ...
- Cause and effect diagram - Increase in productivity | Ecosystem ...
- Split Optic Png Icon
- Fountain Png
- Water Feature Png Top View