Design elements - Zodiac constellations
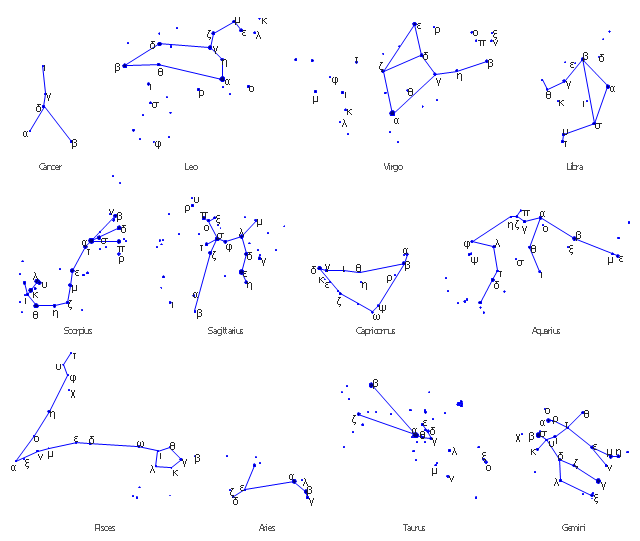
The vector stencils library "Zodiac constellations" contains 12 star constellation charts.
"In Western astrology, astrological signs are the twelve 30º sectors of the ecliptic, starting at the vernal equinox (one of the intersections of the ecliptic with the celestial equator), also known as the First Point of Aries. The order of the astrological signs is Aries, Taurus, Gemini, Cancer, Leo, Virgo, Libra, Scorpio, Sagittarius, Capricorn, Aquarius and Pisces." [Astrological sign. Wikipedia]
"Constellations.
The zodiacal signs are distinct from the constellations associated with them, not only because of their drifting apart due to the precession of equinoxes but also because the physical constellations take up varying widths of the ecliptic, so the sun is not in each constellation for the same amount of time. Thus, Virgo takes up five times as much ecliptic longitude as Scorpius. The zodiacal signs are an abstraction from the physical constellations, and each represent exactly one twelfth of the full circle, or the longitude traversed by the Sun in about 30.4 days.
Some "parazodiacal" constellations are also touched by the paths of the planets. The MUL.APIN lists Orion, Perseus, Auriga, and Andromeda. Furthermore, there are a number of constellations mythologically associated with the zodiacal ones : Piscis Austrinus, The Southern Fish, is attached to Aquarius. In classical maps, it swallows the stream poured out of Aquarius' pitcher, but perhaps it formerly just swam in it. Aquila, The Eagle, was possibly associated with the zodiac by virtue of its main star, Altair. Hydra in the Early Bronze Age marked the celestial equator and was associated with Leo, which is shown standing on the serpent on the Dendera zodiac. Corvus is the Crow or Raven mysteriously perched on the tail of Hydra.
Due to the constellation boundaries being redefined in 1930 by the International Astronomical Union, the path of the ecliptic now officially passes through thirteen constellations: the twelve traditional 'zodiac constellations' plus Ophiuchus, the bottom part of which interjects between Scorpio and Sagittarius. Ophiuchus is an anciently recognized constellation, catalogued along with many others in Ptolemy's Almagest, but not historically referred to as a zodiac constellation. The inaccurate description of Ophiuchus as a sign of the zodiac drew media attention in 1995, when the BBC Nine O'Clock News reported that "an extra sign of the zodiac has been announced by the Royal Astronomical Society". There had been no such announcement, and the report had merely sensationalized the 67-year-old 'news' of the IAU's decision to alter the number of designated ecliptic constellations." [Zodiac. Wikipedia]
The star maps example "Design elements - Zodiac constellations" was created using the ConceptDraw PRO diagramming and vector drawing software extended with the Astronomy solution from the Science and Education area of ConceptDraw Solution Park.
Star constellation charts
TQM Diagram Tool

Physics Symbols

How to Draw a Good Diagram of a Business Workflow?

HelpDesk
How to Draw a Circular Arrows Diagram Using ConceptDraw PRO

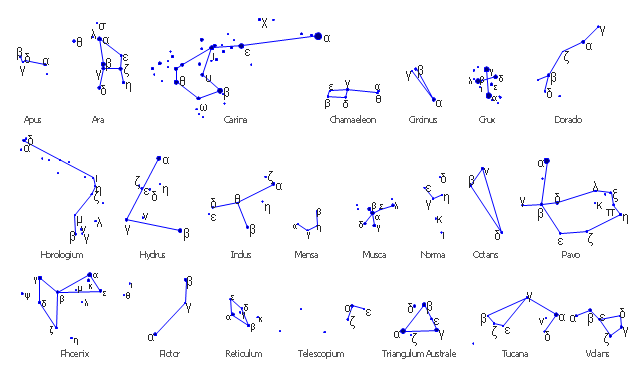
The vector stencils library "Southern constellations" contains 22 star constellations maps for drawing astronomical diagrams.
"In modern astronomy, a constellation is an internationally defined area of the celestial sphere. These areas are grouped around asterisms (which themselves are generally referred to in non-technical language as "constellations"), which are patterns formed by prominent stars within apparent proximity to one another on Earth's night sky.
There are also numerous historical constellations not recognized by the IAU or constellations recognized in regional traditions of astronomy or astrology, such as Chinese, Hindu and Australian Aboriginal." [Constellation. Wikipedia]
The star charts example "Design elements - Southern constellations" was created using the ConceptDraw PRO diagramming and vector drawing software extended with the Astronomy solution from the Science and Education area of ConceptDraw Solution Park.
Southern constellations - Star charts
Business Process Mapping — How to Map a Work Process

Mathematics Symbols

Organizational Chart Templates


Exam Preparation Mind Map

 Pie Charts
Pie Charts are extensively used in statistics and business for explaining data and work results, in mass media for comparison (i.e. to visualize the percentage for the parts of one total), and in many other fields. The Pie Charts solution for ConceptDraw PRO v10 offers powerful drawing tools, varied templates, samples, and a library of vector stencils for simple construction and design of Pie Charts, Donut Chart, and Pie Graph Worksheets.
Diagram Flow Chart

Process Flow Maps

HelpDesk
How to Add a Bubble Diagram to MS Word

Flow chart Example. Warehouse Flowchart


- Constellation Chart | How to Draw a Сonstellation Сhart | Sketching ...
- Constellation Chart | How to Draw a Сonstellation Сhart | Southern ...
- Orion network | Constellation Chart | Constellations except Zodiac ...
- Constellation Chart | Zodiac constellations - Vector stencils library ...
- Sun Solar System | Astronomy Symbols | Sketching Software | Chart ...
- Astrology Map Png
- How to Draw a Сonstellation Сhart | Constellation Chart | Sketching ...
- Zodiac constellations - Vector stencils library | How to Draw a ...
- Virgo Example Of Drawing
- Astronomy Symbols | Design elements - Astronomical symbols ...
- Astronomy and Astrology | Astronomy Symbols | Sun Solar System ...
- Astrology Design For Chart
- Zodiac Constellations Map
- Astronomy and Astrology | Astronomy Symbols | Design elements ...
- Zodiac Star Chart
- Constellation Chart | Design elements - Constellations except ...
- Taurus Example Of Drawing
- Zodiac constellations - Vector stencils library | Astronomy Symbols ...
- Scorpio Constellation Drawing
- Design elements - Southern constellations | Design elements ...