The vector stencils library "Android system icons - content" contains 34 content pictograms.
Use this icon set to design user interface of your Android application.
The icons example "Design elements - Android system icons (content)" was created using the ConceptDraw PRO diagramming and vector drawing software extended with the "Android user interface" solution from the "Software Development" area of ConceptDraw Solution Park.
Content system icons
The vector stencils library "Android system icons - content" contains 41 content pictograms.
Use it to design user interface of your software applications for Android OS with ConceptDraw PRO software.
The icons example "Design elements - Android system icons (content)" was created using the ConceptDraw PRO diagramming and vector drawing software extended with the "Android user interface" solution from the "Software Development" area of ConceptDraw Solution Park.
Content system icons
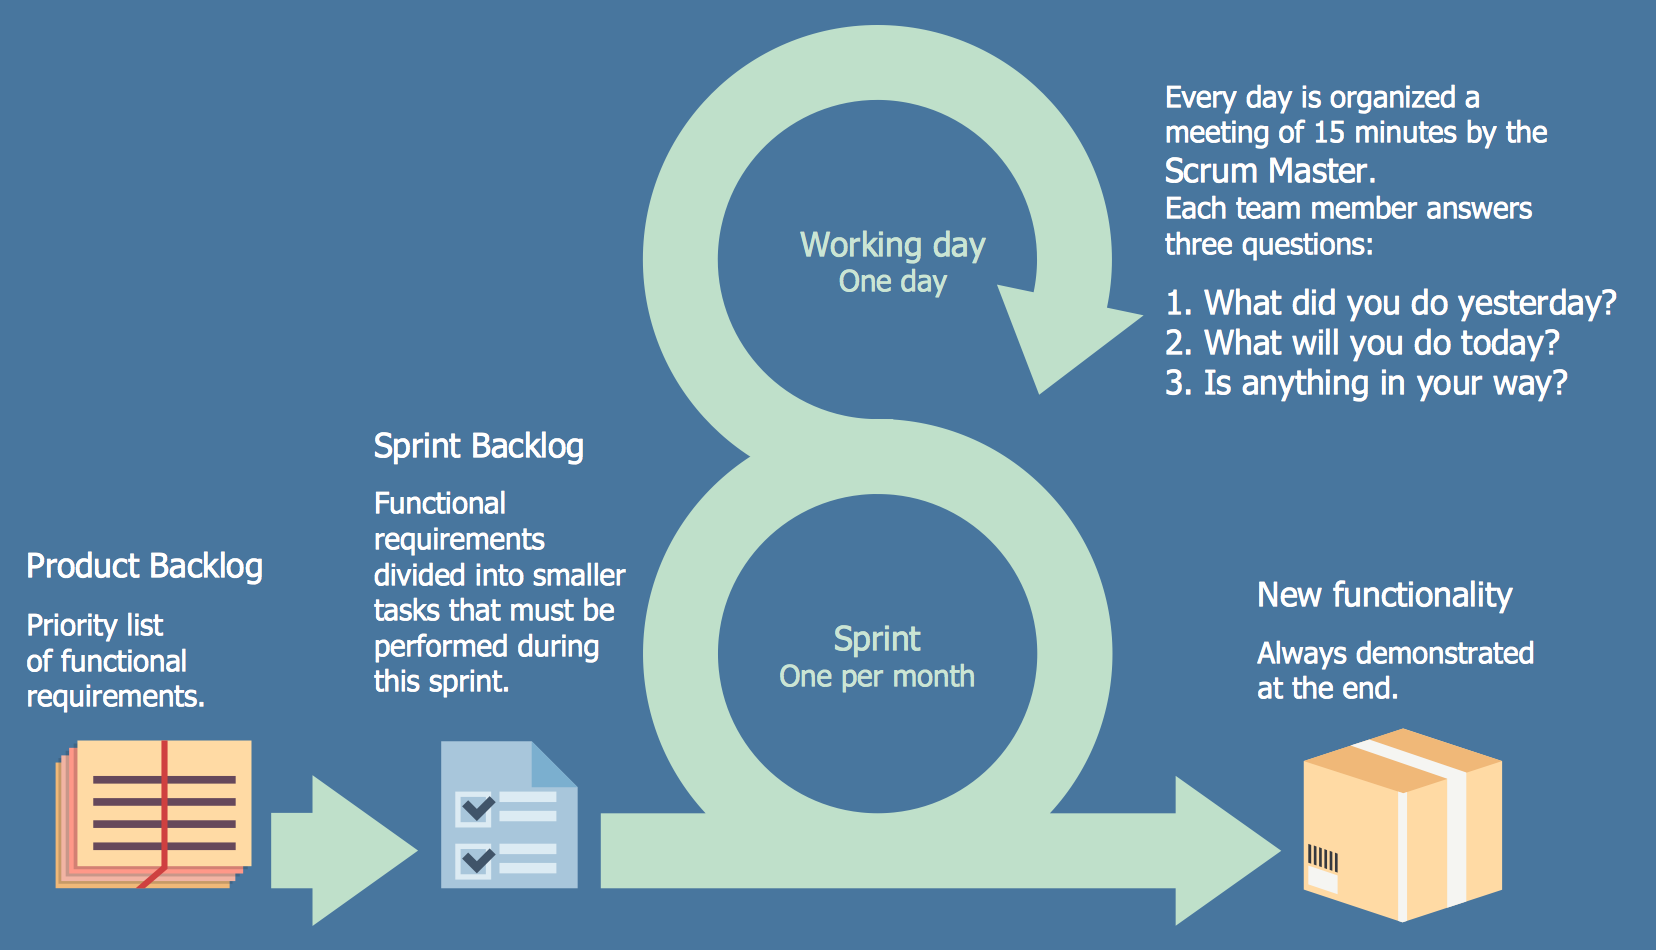
Scrum workflow
HelpDesk
How to Add Several Hyperlinks to a Single Project Task

How to Create a Social Media DFD Flowchart

 ConceptDraw Solution Park
ConceptDraw Solution Park collects graphic extensions, examples and learning materials
Critical Path Method in ConceptDraw PROJECT

How to Connect Social Media DFD Flowchart with Action Maps

ERD Symbols and Meanings


How to Discover Critical Path on a Gantt Chart

Pie Chart Software

State Diagram Example — Online Store

Think and act effectively

 Bar Graphs
The Bar Graphs solution enhances ConceptDraw DIAGRAM functionality with templates, numerous professional-looking samples, and a library of vector stencils for drawing different types of Bar Graphs, such as Simple Bar Graph, Double Bar Graph, Divided Bar Graph, Horizontal Bar Graph, Vertical Bar Graph, and Column Bar Chart.
Sales Process Flowchart Symbols

- Android Icon For Report
- Android Report Icon
- Azure Architecture | Android Checkmark Icon In Png
- Design elements - Android system icons (content) | How to Design ...
- Project Report Icon
- Report | How to Create Presentation of Your Project Gantt Chart ...
- Timer Report Png
- System Icon Android Circle
- Android GUI | Design elements - Android system icons (notification ...
- Design elements - Android system icons (notification) | Design ...
- Design elements - Android system icons (places) | Design elements ...
- Design elements - Android system icons (navigation) | Android UI ...
- Design elements - Android system icons (content) | Android 5.0 ...
- Design elements - Android system icons (content) | Design elements ...
- Design elements - Android system icons (places) | Android User ...
- Design elements - Android system icons (toggle) | Toolbar control ...
- iPhone User Interface | Android 5.0 - App drawer | Android 5.0 ...
- Status Icons Free
- Design elements - Android system icons (content) | How To Send ...
- Design elements - Bars | Design elements - Android system icons ...