Visualize Stakeholder Analysis
Stakeholder analysis in conflict resolution, project management, and business administration, is the process of identifying the individuals or groups that are likely to affect or be affected by a proposed action, and sorting them according to their impact on the action and the impact the action will have on them. Use the ConceptDraw DIAGRAM diagramming and vector drawing software enhanced with powerful tools of Stakeholder Onion Diagrams Solution from the Management Area of ConceptDraw Solution Park to easy and effectively visualize stakeholder analysis.Stakeholder Mapping Tool
Stakeholders are the groups of people or organizations whose contribution matters to the organization's success, this can be labour participation, financial participation, dissemination of information about organization, etc. So, the employees of the company, its suppliers, customers, media, public organizations, state authorities, all they are stakeholders of the company. ConceptDraw DIAGRAM diagramming and vector drawing software extended with Stakeholder Onion Diagrams Solution from the Management Area of ConceptDraw Solution Park is a powerful stakeholder mapping tool which allows easy create Stakeholder Onion diagrams and maps depicting the layers of a project, relationships of stakeholders to a project goal, and relationships between stakeholders.Stakeholder Management System
Stakeholder management is a critical component to the successful delivery of any project, programme or activity. ConceptDraw DIAGRAM is a powerful diagramming and vector drawing software. Now, thanks to the Stakeholder Onion Diagrams Solution included to the Management Area of ConceptDraw Solution Park, ConceptDraw DIAGRAM became also unique stakeholder management system design software.
Stakeholder Onion Diagrams
The Stakeholder Onion Diagram is often used as a way to view the relationships of stakeholders to a project goal. A basic Onion Diagram contains a rich information. It shows significance of stakeholders that will have has influence to the success achieve
HelpDesk
How to Create a Stakeholder Onion Diagram
The Stakeholder Onion Diagram is stakeholder analysis tool from the arsenal of project management. It is used to display the relationships of stakeholders to a project goal. An Onion Diagram shows how stakeholder activities affect project results. The ConceptDraw Stakeholder Onion Diagram solution is intended to depict how the relationships that subsist in a project environment can influence on a project. A set of libraries and objects provided by this solution make short work of visualizing the stakeholder analysis of a project.Business Tools Perceptual Mapping
This sample shows the Perceptual map. It was created in ConceptDraw DIAGRAM diagramming and vector drawing software using the Matrices Solution from the Marketing area of ConceptDraw Solution Park. Perception Mapping helps organizations measure and transform all aspects of their business, people and culture. Perception Mapping allows to represent the complex relationships graphically, helps identify potential problems of the organization and make the best decisions.Stakeholder Onion Diagrams
The Stakeholder Onion Diagram is a popular and widely used way to view the relationships of stakeholders to a project goal. The Onion Diagram focuses on the project goal, most of other diagram styles focus on the project, stakeholders, and timeline. This difference favorably distinguishes and separates the Onion Diagram from other types of diagrams. Design fast and easy Stakeholder Onion Diagrams of any complexity in ConceptDraw DIAGRAM diagramming and vector drawing software using the powerful tools of Stakeholder Onion Diagrams Solution from the Management Area of ConceptDraw Solution Park.Onion Diagram Maker
The onion diagram is a type of diagram which shows the dependencies among parts of an organization or process. The items are displayed at the concentric circles, where the items at the bigger rings depend on the items at the smaller rings. ConceptDraw DIAGRAM diagramming and vector drawing software extended with Stakeholder Onion Diagrams Solution from the Management Area of ConceptDraw Solution Park is a professional Onion Diagram Maker.Stakeholder Onion Diagram Template
For depicting the onion model are actively used Stakeholder Onion Diagrams. The ConceptDraw DIAGRAM diagramming and vector drawing software extended with Stakeholder Onion Diagrams Solution from the Management Area of ConceptDraw Solution Park offers the number of useful tools and Stakeholder Onion Diagram template for their easy design.Competitor Analysis
Competitor analysis is a first and obligatory step in elaboration the proper corporate marketing strategy and creating sustainable competitive advantage. Use powerful opportunities of numerous solutions from ConceptDraw Solution Park for designing illustrative diagrams, charts, matrices which are necessary for effective competitor analysis.How To Create Onion Diagram
An onion diagram is a kind of chart that shows the dependencies among parts of an organization or process. The chart displays items in concentric circles, where the items in each ring depend on the items in the smaller rings. The Onion Diagram is able to show layers of a complete system in a few circles. But how to create Onion Diagram? Now, it's very easy thanks to the ConceptDraw DIAGRAM diagramming and vector drawing software extended with Stakeholder Onion Diagrams Solution from the Management Area of ConceptDraw Solution Park.Onion Diagram Templates
The Onion Diagram is a type of circular diagram which consists of the core circle and concentric circles that look like the cross sections of onion. The key value of the Onion Diagram is to visually demonstrate the relationships that lead to a successful final product or deliverable. Design of Onion Diagrams and Stakeholder Onions Diagrams is a complex process, but ConceptDraw DIAGRAM diagramming and vector drawing software makes it easier thanks to the Stakeholder Onion Diagrams Solution from the Management Area of ConceptDraw Solution Park, and the set of included libraries and Onion Diagram templates.Gane Sarson Diagram
The Gane-Sarson methodology uses the graphical techniques for building the logical models for the systems. It is helpful for analysts and designers to make common and clear picture of the system, to depict all its processes and how they transform the data. The Gane-Sarson methodology lets represent all this information in a way understandable for the users and other interested people, and gives the possibility to see instantly how the system's parts serve together to meet their needs. This methodology supposes the building of a system top-down. First you need create an overall system data flow, then determine the details of the data structures, the process logic and design the modular structures. ConceptDraw DIAGRAM diagramming and vector drawing software offers the Data Flow Diagrams solution with Gane-Sarson Notation library rich for the specific symbols of the Gane-Sarson notation. All they are vector and fully ready-to-use for drawing the Data Flow Diagrams, which will be then successfully used in presentations, websites, and various business documents.
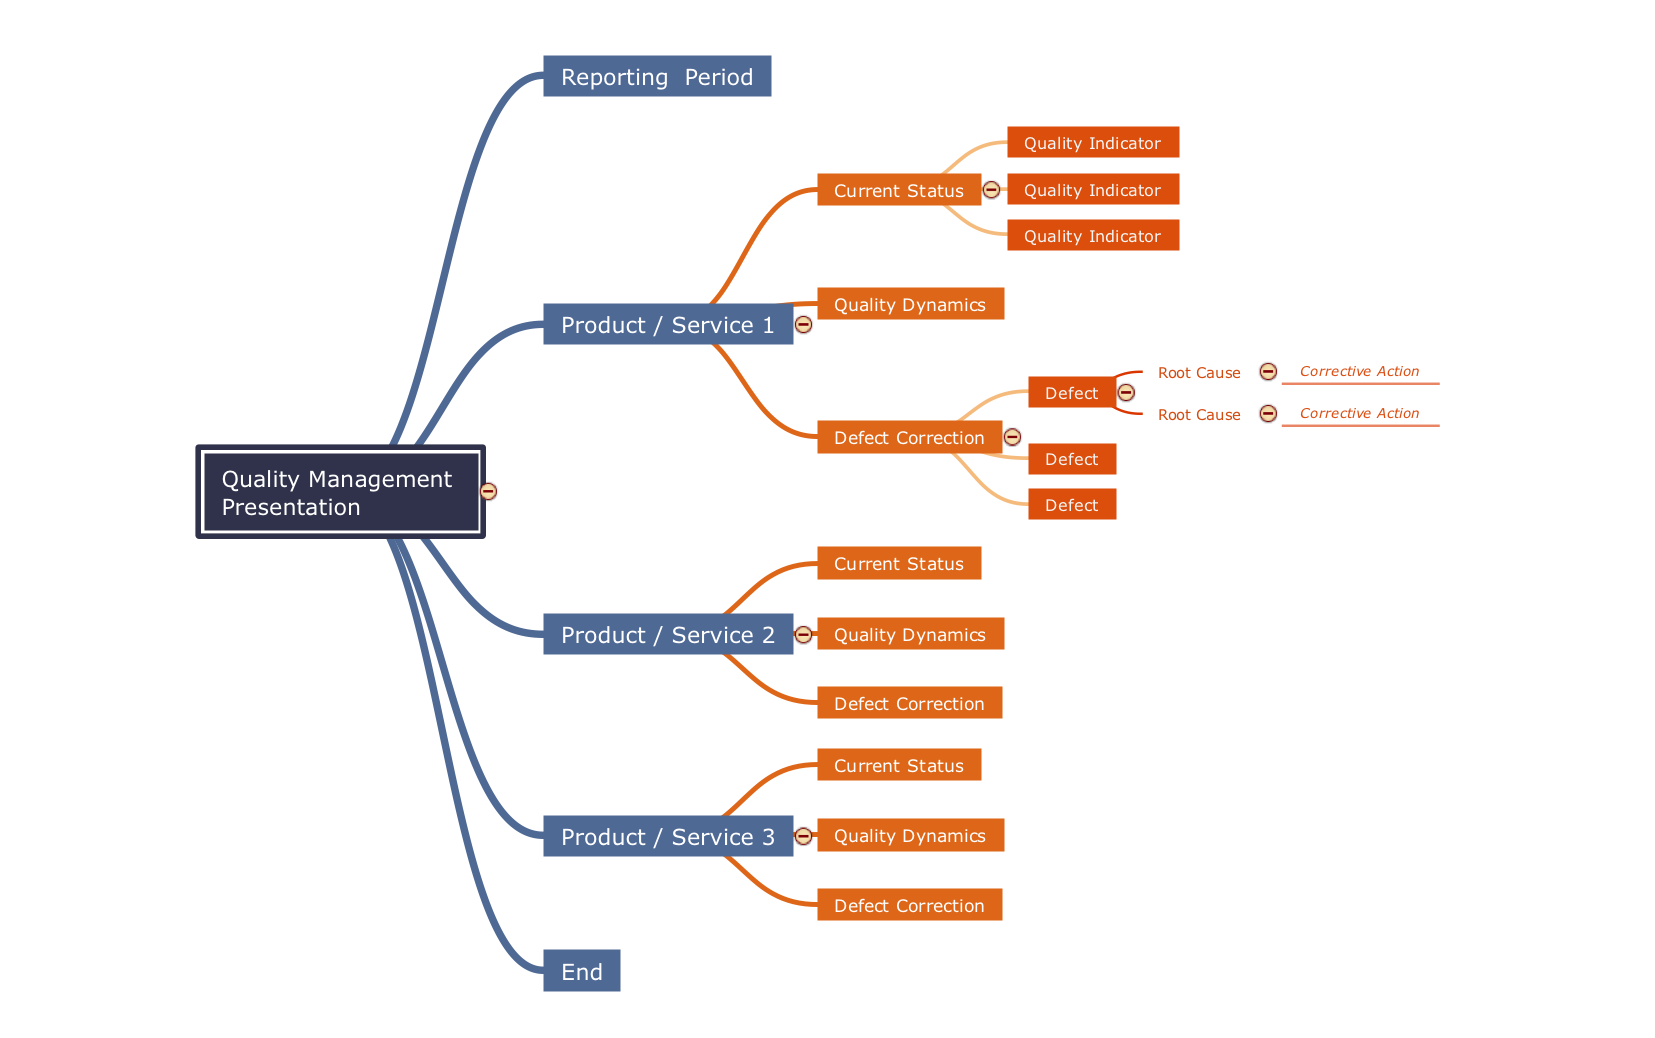
Quality Criteria MindMap
Quality Management Mind Maps - Presentations, Meeting Agendas, Problem will be solved. The visual form of mind maps is helpful in all stages of quality management, from describing problem to describing and documenting a decision.
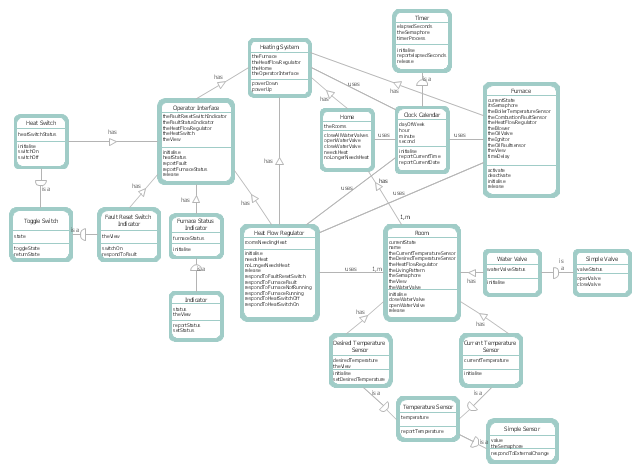
This DFD sample was created on the base of the figure illustrating "A Survey of Object-Oriented Methods" by Peter Biggs from University of Durham.
[students.cs.byu.edu/ ~pbiggs/ images/ coadsys.gif]
"Object-oriented analysis and design (OOAD) is a popular technical approach to analyzing, designing an application, system, or business by applying the object-oriented paradigm and visual modeling throughout the development life cycles to foster better stakeholder communication and product quality.
According to the popular guide Unified Process, OOAD in modern software engineering is best conducted in an iterative and incremental way. Iteration by iteration, the outputs of OOAD activities, analysis models for OOA and design models for OOD respectively, will be refined and evolve continuously driven by key factors like risks and business values." [Object-oriented analysis and design. Wikipedia]
The DFD example "Coad/ Yourdon's Object-Oriented Analysis model" was created using the ConceptDraw PRO diagramming and vector drawing software extended with the Data Flow Diagrams solution from the Software Development area of ConceptDraw Solution Park.
- Visualize Stakeholder Analysis | Stakeholder Mapping Tool ...
- Visualize Stakeholder Analysis | Stakeholder Management System ...
- SWOT Analysis | Stakeholder Mapping Tool | Swot Analysis About ...
- Stakeholder Mapping Tool | Visualize Stakeholder Analysis ...
- Competitor Analysis | Timeline Diagrams | Stakeholder Mapping ...
- SWOT Analysis | SWOT and TOWS Matrix Diagrams | Stakeholder ...
- SWOT Analysis | Stakeholder Mapping Tool | Planogram Software ...
- Stakeholder Management System | Stakeholder Onion Diagrams ...
- Visualize Stakeholder Analysis | Stakeholder Mapping Tool | JSD ...
- SWOT and TOWS Matrix Diagrams | Stakeholder Onion Diagrams ...
- Cause and Effect Analysis - Fishbone Diagrams for Problem Solving ...
- Stakeholder Mapping Tool | Stakeholder Onion Diagrams ...
- Stakeholder Onion Diagrams | How to Create a Stakeholder Onion ...
- What is SWOT Analysis in Marketing | SWOT Analysis | Swot ...
- Stakeholder Onion Diagrams | Business Swot Analysis For Training ...
- Stakeholder Mind Map Circle
- Stakeholder Onion Diagrams
- Stakeholder Onion Diagram Template | Onion Diagram Templates ...
- Stakeholder Onion Diagram Template
- Stakeholder Onion Diagrams | Stakeholder Onion Diagrams | Onion ...