 Floor Plans
Construction, repair and remodeling of the home, flat, office, or any other building or premise begins with the development of detailed building plan and floor plans. Correct and quick visualization of the building ideas is important for further construction of any building.
Stakeholder Onion Diagram Template

Baseball Field Sample

Household Moving Checklist

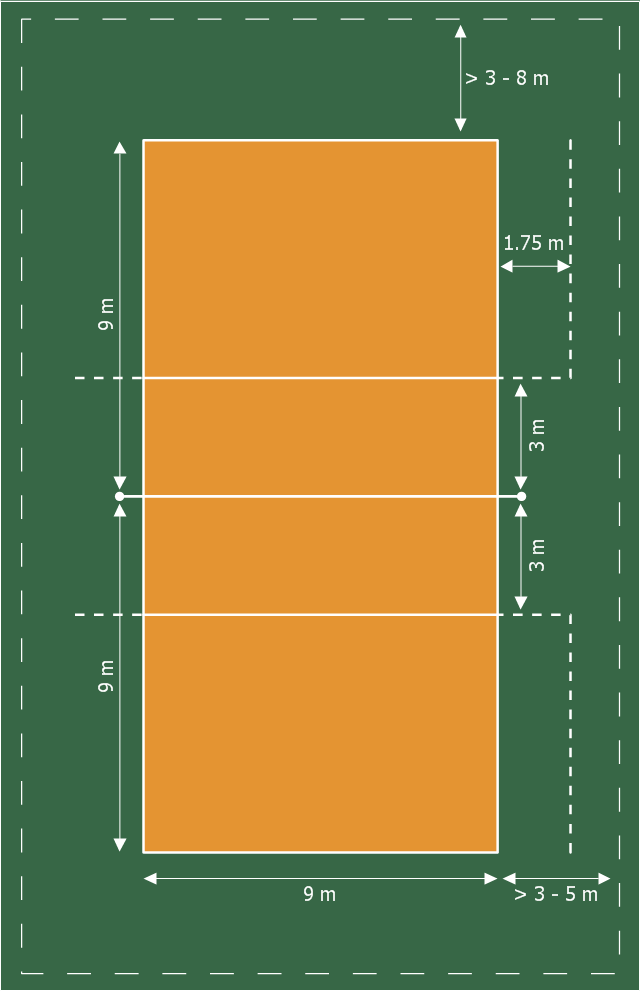
This sport field plan sample was designed on the base of the Wikipedia file: VolleyballCourt.svg. [en.wikipedia.org/ wiki/ File:VolleyballCourt.svg]
This file is licensed under the Creative Commons Attribution-Share Alike 3.0 Unported license. [creativecommons.org/ licenses/ by-sa/ 3.0/ deed.en]
"Volleyball is a team sport in which two teams of six players are separated by a net. Each team tries to score points by grounding a ball on the other team's court under organized rules. It has been a part of the official program of the Summer Olympic Games since 1964. ...
The court dimensions.
A volleyball court is 18 m (59 ft) long and 9 m (29.5 ft) wide, divided into 9 m × 9 m halves by a one-meter (40-inch) wide net. The top of the net is 2.43 m (8 ft 0 in) above the center of the court for men's competition, and 2.24 m (7 ft 4 in) for women's competition, varied for veterans and junior competitions.
The minimum height clearance for indoor volleyball courts is 7 m (23 ft), although a clearance of 8 m (26 ft) is recommended.
A line 3 m (9.84 ft) from and parallel to the net is considered the "attack line". This "3 meter" (or "10-foot") line divides the court into "back row" and "front row" areas (also back court and front court). These are in turn divided into 3 areas each: these are numbered as follows, starting from area "1", which is the position of the serving player.
After a team gains the serve (also known as siding out), its members must rotate in a clockwise direction, with the player previously in area "2" moving to area "1" and so on, with the player from area "1" moving to area "6".
The team courts are surrounded by an area called the free zone which is a minimum of 3 meters wide and which the players may enter and play within after the service of the ball. All lines denoting the boundaries of the team court and the attack zone are drawn or painted within the dimensions of the area and are therefore a part of the court or zone. If a ball comes in contact with the line, the ball is considered to be "in". An antenna is placed on each side of the net perpendicular to the sideline and is a vertical extension of the side boundary of the court. A ball passing over the net must pass completely between the antennae (or their theoretical extensions to the ceiling) without contacting them." [Volleyball. Wikipedia]
The sport field plan example "Volleyball court dimensions" was created using the ConceptDraw PRO diagramming and vector drawing software extended with the Sport Field Plans solution from the Building Plans area of ConceptDraw Solution Park.
Sport field plan
Cross-Functional Flowchart


Electrical Diagram Software


Donut Chart Templates

Electrical Symbols — Inductors

 School and Training Plans
School and Training Plans solution enhances ConceptDraw DIAGRAM functionality with extensive drawing tools, numerous samples and examples, templates and libraries of classroom design elements for quick and professional drawing the School and Training plans, School Floor plans, Classroom Layout, Classroom Seating chart, Lecture Room plans of any complexity. Each offered classroom seating chart template is a real help for builders, designers, engineers, constructors, as well as teaching personnel and other teaching-related people in drawing Classroom Seating charts and Training Room layouts with ConceptDraw DIAGRAM classroom seating chart maker.
SWOT Matrix

 Business Diagrams
The Business Diagrams Solution extends ConceptDraw DIAGRAM with an extensive collection of professionally designed illustrative samples and a wide variety of vector stencils libraries, which are the real help for all business-related people, business analysts, business managers, business advisers, marketing experts, PR managers, knowledge workers, scientists, and other stakeholders allowing them to design the bright, neat, expressive and attractive Bubble Diagrams, Circle-Spoke Diagrams, Circular Arrows Diagrams, and Venn Diagrams with different quantity of sets in just minutes; and then successfully use them in documents, reports, statistical summaries, and presentations of any style.
Business Diagram Software


SWOT analysis matrix diagram templates

Competitor Analysis

- Volleyball court dimensions | Sport Field Plans | Chess | All Games ...
- Throw Ball Ball Measure Ment
- Volleyball court dimensions | Volleyball Ground Measurement Wiki
- Measurement Of Volleyball Court In Meters Pdf
- Volleyball Court Dimensions Pdf
- Volleyball court dimensions | Sport Field Plans | How to Create a ...
- Soccer (Football) Dimensions | Design a Soccer (Football) Field | Ice ...
- Scrum Workflow | Agile Methodology | Scrum | Agile Software ...
- Positioning map
- Positioning map | Competitor Analysis | Service 8 Ps fishbone ...
- Positioning map | Competitor Analysis | Service 8 Ps fishbone ...
- Winter Sports. Illustrations and Visualize Statistics | International ...
- Competitive feature comparison matrix chart - Digital scouting cameras
- How to Make Soccer Position Diagram Using ConceptDraw PRO ...
- Sun Solar System | Stars and planets - Vector stencils library | Stars ...
- Manufacturing 8 Ms fishbone diagram - Template | Fishbone ...
- Matrices | Competitor Analysis | BCG Matrix | Types Of Matrix In ...
- Deployment Chart Software | 25 Typical Orgcharts | Feature ...
- How to Make SWOT Analysis in a Word Document | Marketing ...
- Flow chart Example. Warehouse Flowchart | DFD - Process of ...