
Sample 1. Household moving checklist.
This sample shows the household moving checklist. It's very important to make the checklist of the things when you move from one house to another. When you have the checklist your moving will be easy and simple, and you will not forget anything.
Use the ready-to-use objects from the Basic Diagramming Solution for ConceptDraw DIAGRAM to create your own professional looking moving checklists quick and easy.
The documents produced with ConceptDraw DIAGRAM are vector graphic documents and are available for reviewing, modifying, and converting to a variety of formats (image, HTML, PDF file, MS PowerPoint Presentation, Adobe Flash or MS Visio).
TEN RELATED HOW TO's:
In general, you can use any icons to represent network equipment on a diagram. However, there are some icons, for instance, Cisco icons, shapes, stencils and symbols, that are recognizable worldwide. Using those icons you can create Cisco network topology diagrams in minutes and share them anywhere.
The icons depicting Cisco network equipment are recognized and generally applied as standard images for designing network diagrams. They are free to used , but can not be reworked. Cisco network diagrams are created to depict how signals processed on the network equipment and end-user computers and how data transfer through LAN or WLAN between nodes. The vector graphic library of ConceptDraw CISCO Network Diagrams solution includes about 90 icons of Cisco network equipment for designing computer network diagrams with ConceptDraw DIAGRAM.
Picture: Cisco Network Topology. Cisco icons, shapes, stencils and symbols
Related Solution:
ConceptDraw DIAGRAM diagramming and vector drawing software extended with Target and Circular Diagrams solution from the Marketing area of ConceptDraw Solution Park is perfect for the Circular Flow Diagram creating.
Picture: The Circular Flow Diagram
Related Solution:
Computer networks nowadays are spread all across the world. The large number of parameters, such as geographic scale or communication protocols, can divide networks. One of the most common types of networks is called local area network (LAN). It convenient to represent network examples by means of diagrams.
This local area network (LAN) diagram provides an easy way to see the way the devices in a local network are interacted. The diagram uses a library containing specific symbols to represent network equipment , media and the end-user devices such as computers (PC, mac, laptop) , network printer, hubs, server and finally a modem. There are two types of network topologies: physical and logical. The current diagram represents precisely a physical type of LAN topology because it refers to the physical layout of a local network equipment.
Picture:
What is a Local Area Network?
Examples of LAN Diagrams
Related Solution:
If you want to find a way to understand complex things in minutes, you should try to visualize data. One of the most useful tool for this is creating a flowchart, which is a diagram representing stages of some process in sequential order. There are so many possible uses of flowcharts and you can find tons of flow charts examples and predesigned templates on the Internet. Warehouse flowchart is often used for describing workflow and business process mapping. Using your imagination, you can simplify your job or daily routine with flowcharts.
Warehouse flowcharts are used to document product and information flow between sources of supply and consumers. The flowchart provides the staged guidance on how to manage each aspect of warehousing and describes such aspects as receiving of supplies; control of quality; shipment and storage and corresponding document flow. Warehouse flowchart, being actual is a good source of information. It indicates the stepwise way to complete the warehouse and inventory management process flow. Also it can be very useful for an inventory and audit procedures.
Picture: Flow Chart Example: Warehouse Flowchart
Related Solution:
Four lessons explaining how to manage your task list in a Gantt chart. You will learn how to adjust your Gantt chart view, how to add/delete tasks or subtasks, how to change tasks hierarchy, how to show/hide subtasks.
Picture: Managing the task list
There are many tools to manage a process or to illustrate an algorithm or a workflow. Flowcharting is one of those tools. However, it may be difficult to show complex processes that require multiple attributes or several people in a simple flowchart, so a cross-functional flowchart would be a solution for that situation. To create such flowchart, group processes and steps to labeled rows or columns, and divide those groups with horizontal or vertical parallel lines. It is worth mentioning that there are different types of cross-functional flowcharts, like opportunity or deployment flowchart.
This diagram shows a cross-functional flowchart that was made for a trading process. It contains 14 processes, distributed through 5 lines depicting the participants who interact with the process. Also there are connectors that show the data flow of information between processes. The cross-functional flowchart displays a detailed model of the trading process, as well as all participants in the process and how they interact with each other. The lines in the flowchart indicates the position, department and role of the trading process participants.
Picture: Cross-Functional Flowchart
Related Solution:
When thinking about data visualization, one of the first tools that comes to mind is a flowchart design. You can find flowchart symbols, shapes, stencils and icons easily on the Internet, but it might take time to systematize this information. Nevertheless, once you start flowcharting, you’ll love its simplicity and efficiency.
This diagram consists from standard flowchart symbols, approved by ANSI (American National Standard Institute) for drawing flowcharts. A flowchart is a diagram that represents a step-by-step algorithm of any process, displaying the process stages as boxes that are connected with arrows. Flowchart design makes it clear and readable.
Flowchart designed using ConceptDraw DIAGRAM flowchart software allows to make attractive and clear process presentation, it makes interpretation of the business process flow fresh and versatile. Great flowchart design view is a big advantage over the diagram created manually on a paper.
Picture: Flowchart Design: Principles, Layout, Symbols and Best Practices
Related Solution:
Analysis is very important part for every business, as it helps to understand the weakness and to see the opportunities, and SWOT is one of the most effective tools. To illustrate the multifunctionality of this tool, let’s imagine a SWOT sample in area of computers networking, which can be carried out to realize the pros and cons of some equipment, for example. Even a network topology or a administer can be a subject for this analysis.
This SWOT analysis matrix illustrate the sample of using this useful technique for comprehension of Strengths and Weaknesses, and for determining the Opportunities open to business and the Threats it encounters. Used in a business scope, it will help to create a perspective niche in the market for particular business. The ConceptDraw SWOT and TOWS Analysis solution gives a lot of templates of both SWOT and TOWS matrices that allow managers and marketers create custom diagrams to perform SWOT or TOWS analysis in context of a particular business.
Picture: SWOT Sample in Computers
The Audio & Video Connectors solution contains a set of pre-designed objects, libraries, templates, and samples; allowing quick and easy diagramming of various configurations of audio and video devices.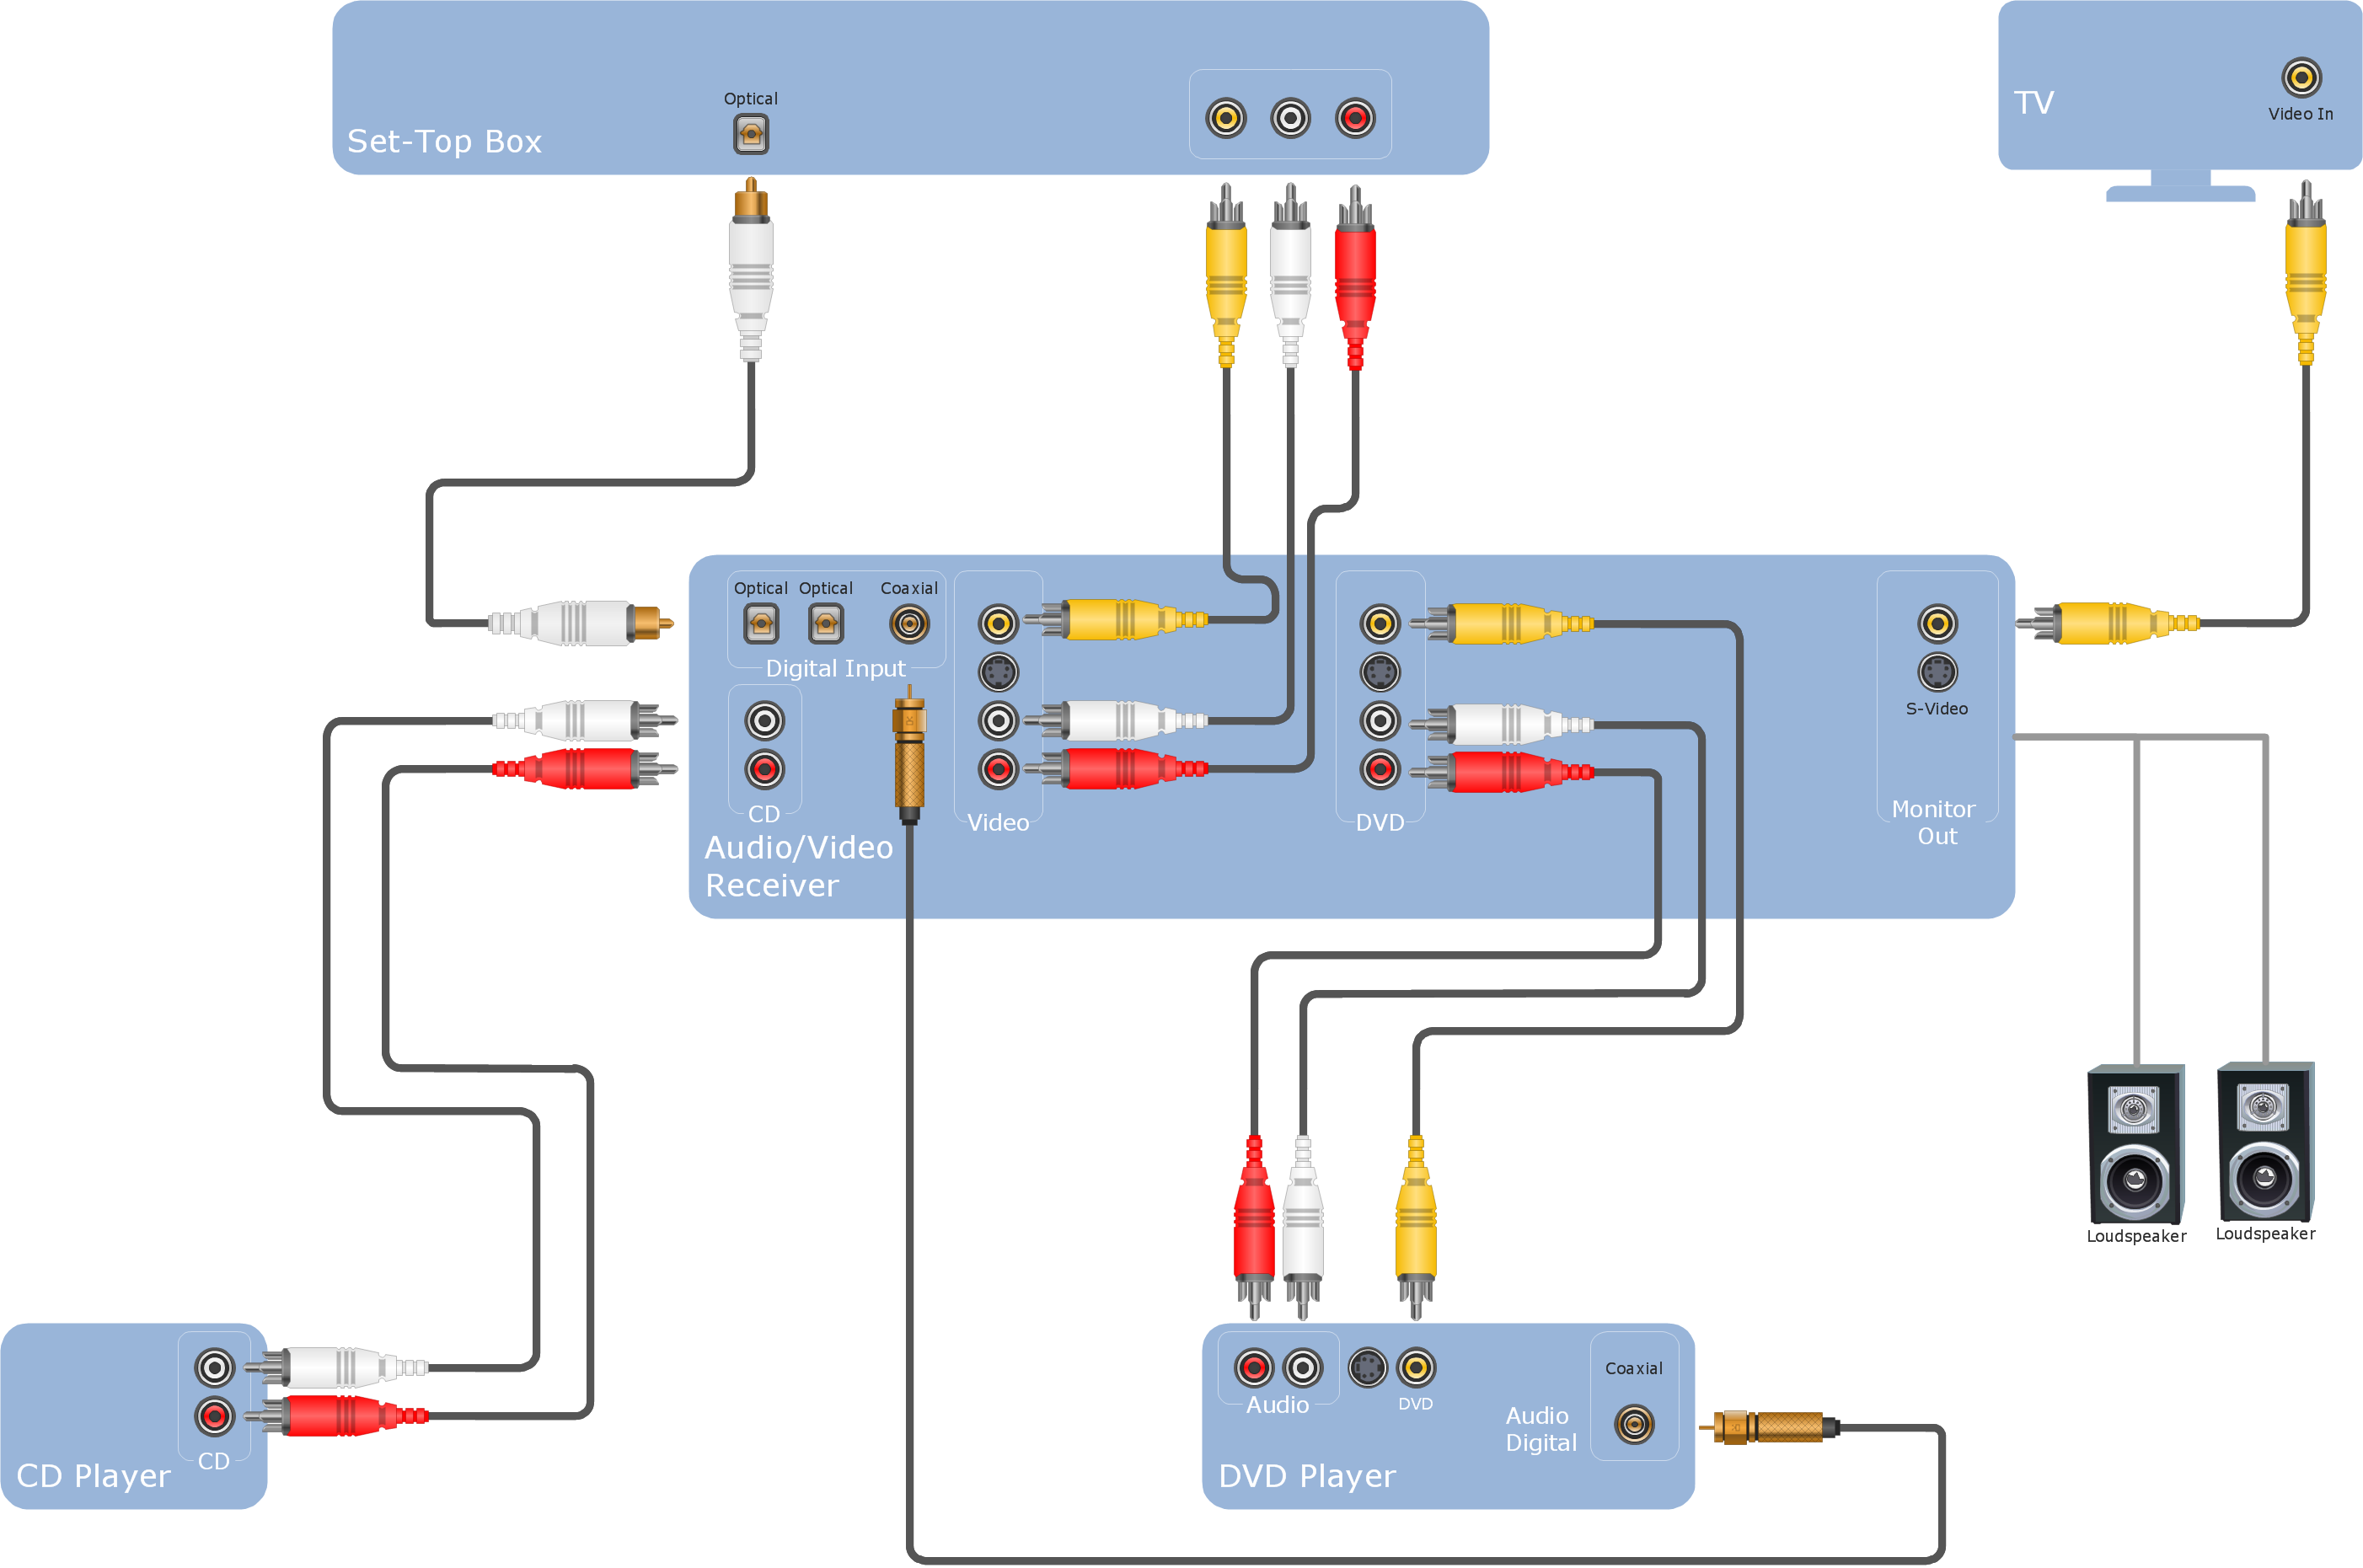
Picture: Audio and Video Configurations
Related Solution:
Set of vector cliparts, samples, templates and libraries helps you to create all sorts of new imagesthe for Money Illustrations.
Various styles of money design elements (currency symbols, clipart, money symbols) can be found in ConceptDraw DIAGRAM Business and Finance Solution.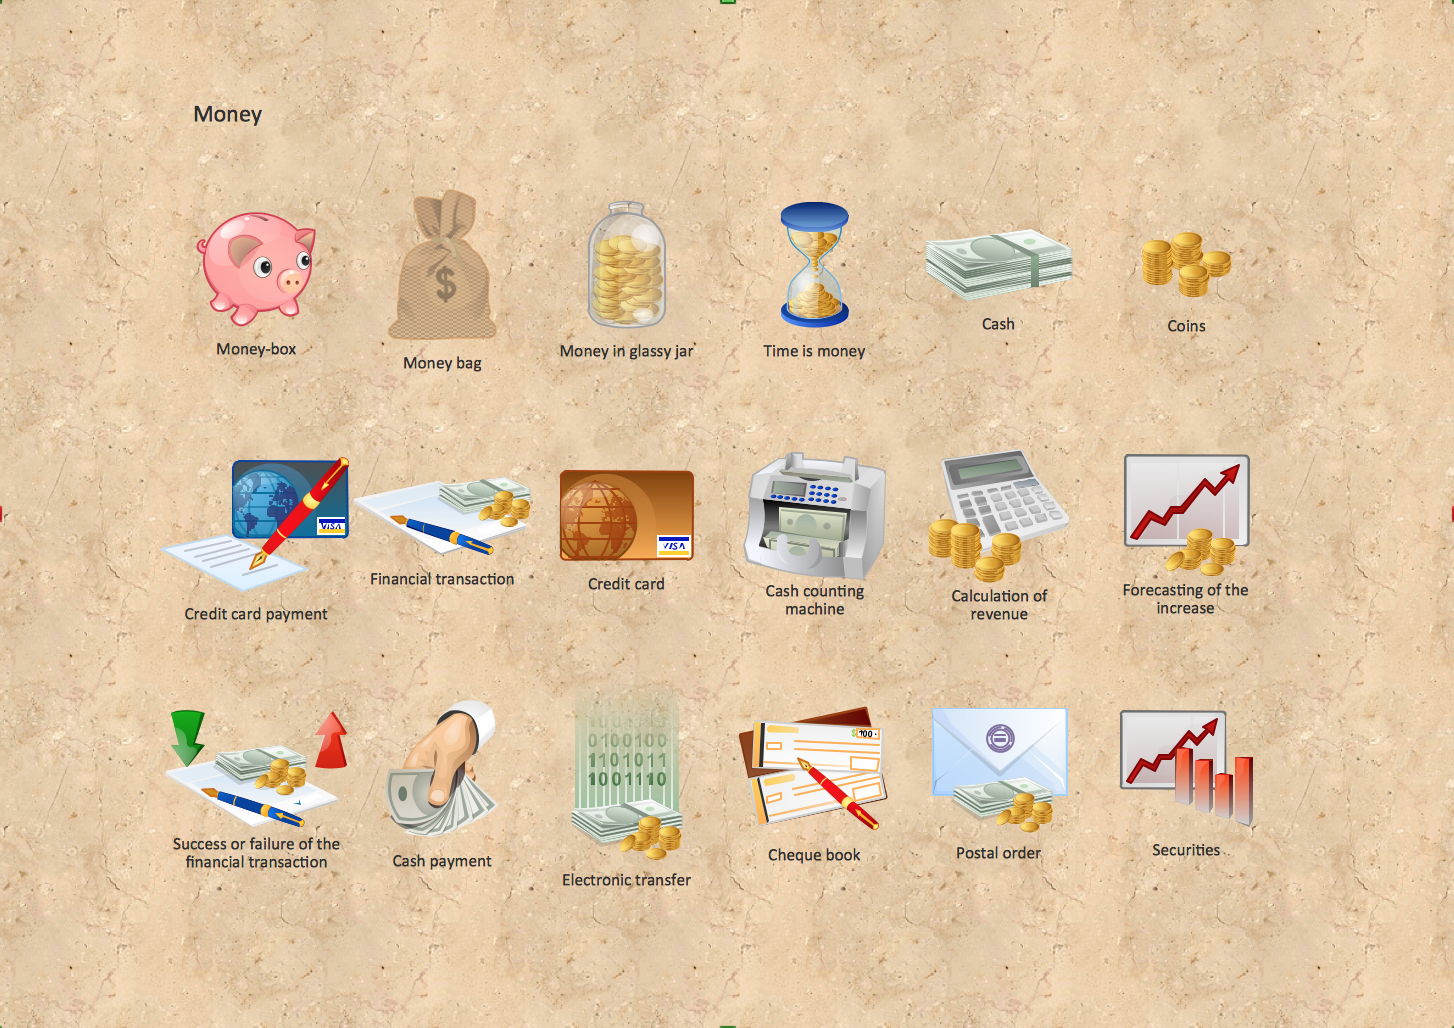
Picture: Money - Design Elements
Related Solution: