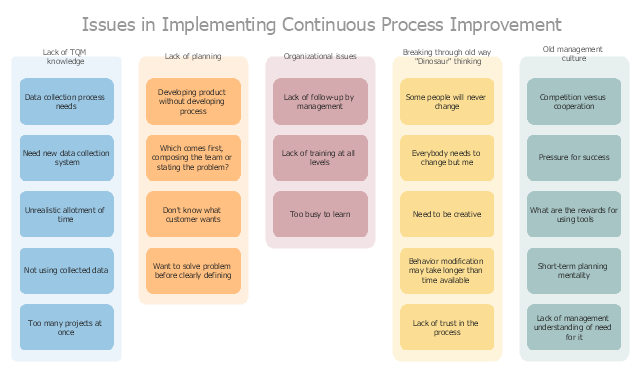
"A continual improvement process, also often called a continuous improvement process (abbreviated as CIP or CI), is an ongoing effort to improve products, services, or processes. These efforts can seek "incremental" improvement over time or "breakthrough" improvement all at once. Delivery (customer valued) processes are constantly evaluated and improved in the light of their efficiency, effectiveness and flexibility.
Some see CIPs as a meta-process for most management systems (such as business process management, quality management, project management, and program management)." [Continual improvement process. Wikipedia]
The affinity diagram example "Implementing continuous process improvement" was created using the ConceptDraw PRO diagramming and vector drawing software extended with the solution "Seven Management and Planning Tools" from the Management area of ConceptDraw Solution Park.
Affinity diagram
PROBLEM ANALYSIS. Identify and Structure Factors


Affinity Diagram

Affinity Diagram

 Seven Management and Planning Tools
Seven Management and Planning Tools solution extends ConceptDraw PRO and ConceptDraw MINDMAP with features, templates, samples and libraries of vector stencils for drawing management mind maps and diagrams.
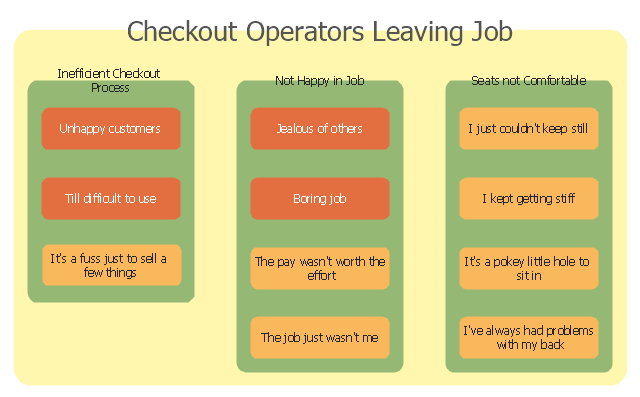
"Point of sale (also called POS or checkout) is the place where a retail transaction is completed. It is the point at which a customer makes a payment to the merchant in exchange for goods or services. At the point of sale the retailer would calculate the amount owed by the customer and provide options for the customer to make payment. The merchant will also normally issue a receipt for the transaction. ...
The modern point of sale is often referred to as the point of service because it is not just a point of sale but also a point of return or customer order. Additionally it includes advanced features to cater to different functionality, such as inventory management, CRM, financials, warehousing, etc., all built into the POS software. Prior to the modern POS, all of these functions were done independently and required the manual re-keying of information, which can lead to entry errors." [Point of sale. Wikipedia]
The affinity diagram example "Checkout operators leaving job" was created using the ConceptDraw PRO diagramming and vector drawing software extended with the solution "Seven Management and Planning Tools" from the Management area of ConceptDraw Solution Park.
Affinity diagram
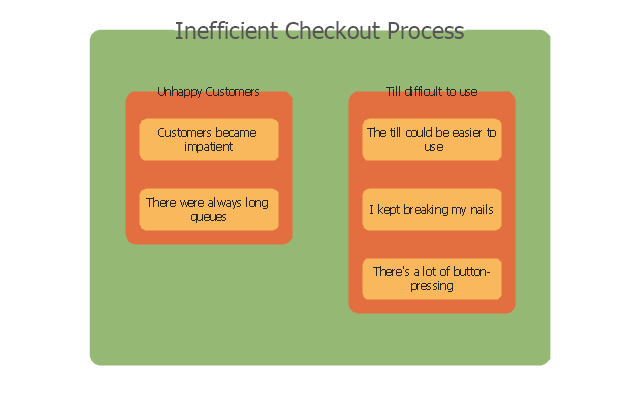
Inefficient checkout process
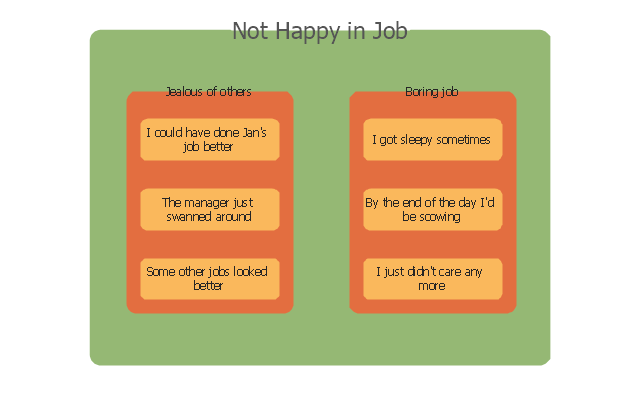
Not happy in job
 Seven Management and Planning Tools
Seven Management and Planning Tools solution extends ConceptDraw PRO and ConceptDraw MINDMAP with features, templates, samples and libraries of vector stencils for drawing management mind maps and diagrams.
HelpDesk
How To Create an Affinity Diagram Using ConceptDraw Office

The Action Plan

PROBLEM ANALYSIS. Relations Diagram

CORRECTIVE ACTIONS PLANNING. PERT Chart

PDPC

PROBLEM ANALYSIS. Prioritization Matrix

CORRECTIVE ACTIONS PLANNING. Risk Diagram (PDPC)
 - Health care")
- Affinity Diagram | Affinity Diagram Software | Affinity diagram ...
- Affinity Diagram | Affinity diagram - Implementing continuous ...
- Affinity diagram - Implementing continuous process improvement ...
- Affinity diagram - Implementing continuous process improvement
- Affinity diagram - Implementing continuous process improvement
- Seven Management and Planning Tools | Affinity diagram ...
- Affinity diagram - Implementing continuous process improvement
- Affinity Diagram | How To Create an Affinity Diagram Using ...
- Affinity diagram - Business expansion | BPR Diagram. Business ...
- Purchasing Flowchart - Purchase Order. Flowchart Examples ...
- Affinity diagram - Implementing continuous process improvement
- Process Flowchart | Affinity Diagram | Fishbone Diagram ...
- Affinity diagram - Business expansion | BPR Diagram. Business ...
- Affinity diagram - Checkout operators leaving job | Affinity diagram ...
- Onion Diagram Templates | Affinity Diagram | Business Process ...
- Process Flowchart | How to Draw a Line Chart Quickly | Affinity ...
- Affinity Diagram With Examples
- Affinity Diagram Software | Affinity Diagram | Affinity Diagram ...
- Affinity diagram - Checkout operators leaving job | Flow chart ...
- Seven Management and Planning Tools | Affinity diagram ...